
In this post, you will learn how to measure how much a new channel, such as TikTok, a podcast, or CTV, lifts the organic and direct conversions that usually get the credit. You'll use Attribution's multi-touch paths to find conversions the new channel started, compare organic and direct volume against a baseline, and use Twilio Segment's bidirectional integration to send each customer's first, middle, and last touchpoints back into their Twilio Segment profile and your warehouse.
Most of this works out of the box with no code. The warehouse lift table at the end is optional, for teams that want the result next to spend in BigQuery, Snowflake, or Redshift. We'll also cover what to do when a channel doesn't produce clicks at all, such as TV, radio, and most podcast listens.
Prerequisites
To get started, you will need:
- A Twilio Segment source on your site or app, connected to the Attribution (Actions) destination with your Attribution Project ID. See the Twilio Segment setup guide for where to find it.
- Your ad platforms connected in Attribution so spend and clicks arrive and channels build themselves. See the ad integrations overview. For channels without a native integration, spend can come in through a partner like StackAdapt, the API, or a CSV upload.
- Segment Reverse - Identity turned on. Ask Attribution to enable the bidirectional integration, then add your Twilio Segment write key under Settings > Conversion Integration. The reverse sync setup guide walks through it.
- A saved view of your conversion event, whether that's a purchase or a sales-qualified lead (SQL).
- At least four weeks of data before the new channel goes live, and the same weeks from last year if you have them.
- Optional: a Twilio Segment warehouse destination (BigQuery, Snowflake or Redshift) for the lift table.
What is channel lift?
Multi-touch attribution splits a conversion's credit across the touchpoints in its path. For example, a linear model splits credit evenly across the first, middle, and last touchpoints. Incrementality asks a harder question: what would have happened without the channel?
New channels rarely close the deal on their own. Someone sees a TikTok ad, hears a podcast ad, or catches a CTV spot, and a week later they Google the brand or type the URL in directly. In most reports, Organic and Direct get the credit. Attribution records every visit from the first one, before it knows who the visitor is, so when that person converts on an organic or direct visit, the earlier touchpoint from the new channel is still on their path. Once they identify themselves on another device, Twilio Segment and Attribution stitch those visits into one journey. See Paths for how journeys are built.
That gives you two reads on the same launch:
- Assisted lift. Organic and direct conversions with the new channel earlier in the path, from the first touch through the middle touchpoints to an organic or direct last touchpoint.
- Baseline lift. The change in total organic and direct conversions against the weeks before launch and the same weeks last year.
When both move together, the channel is creating demand. If assisted lift climbs while the baseline stays flat, the channel is mostly touching people who were coming anyway. Neither line is straight. Seasonality, promotions, and other launches all move organic and direct, which is why comparing against last year matters as much as the four weeks before launch.
When the new channel doesn't produce clicks
Assisted lift needs a touchpoint to find. Some people will hear an ad or see a spot and go straight to your site without ever clicking, and click data alone can't tie that visit back. Attribution has a few ways to close that gap:
- Tag every link you control. Vanity URLs and promo links read in a podcast, QR codes on a CTV spot, and links in a TikTok bio all create a trackable touchpoint when they carry UTM parameters.
- TV and radio attribution. Upload your spot logs as a CSV with the channel, the ad or creative name, and the air time to the second. Attribution credits visits that arrive within eight minutes of each spot airing to that spot, whether they come in as direct, organic, or any other channel. Add country, region, or city to limit matches to the spot's market. These visits show up as touchpoints for that channel in your paths and multi-touch model. See TV attribution; it's a paid add-on.
- View-through for programmatic CTV. StackAdapt brings in daily spend, total impressions, and clicks. For view-through credit, Attribution can load impression data by CSV and match it to users as a custom touchpoint. Talk to the Attribution team to set this up.
For whatever exposure is left untracked, baseline lift is your read.
How the data flows
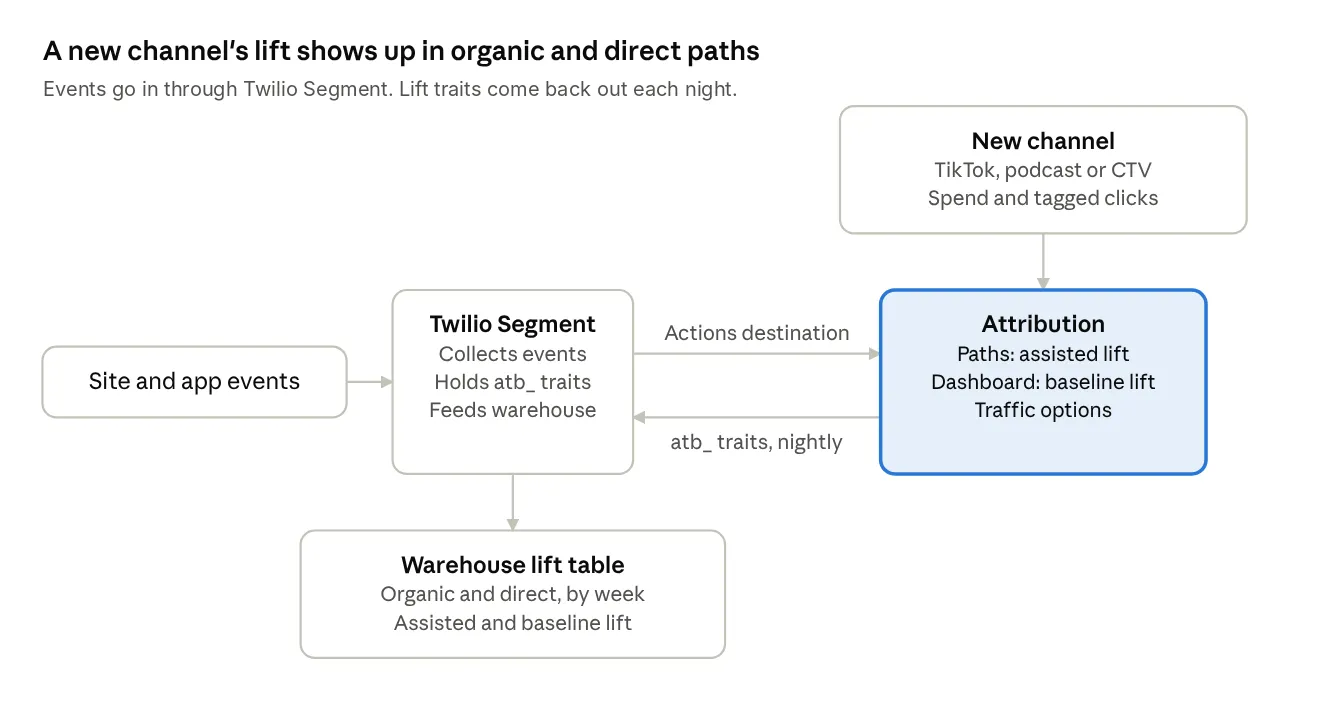
Twilio Segment carries site and app events into Attribution. The new channel's spend lands in Attribution through an integration, a partner, the API, or a CSV upload. Each night, Attribution sends identify calls back to Twilio Segment with traits prefixed atb_, like first touch channel and customer path, so every identified profile carries its full journey. See below for how the pieces connect:
Why use Twilio Segment and Attribution together
The Twilio Segment and Attribution integration runs both ways. Events flow in through the Attribution (Actions) destination, and attributed results flow back out through the reverse sync. That second half is what makes this more than a report: the first, middle, and last touchpoints behind every conversion become traits on the Twilio Segment profile, ready for your warehouse, CRM, or any other Destination you have in Twilio Segment.
For example, with this setup you can:
- Give upper-funnel spend credit for the branded search and direct returns it causes, not just the clicks it closes.
- Spot cannibalization early. If branded paid search climbs after launch while organic drops by about the same amount, your ads may be claiming conversions organic would have closed.
- Switch the view's traffic option to Exclude all Direct Traffic and see what your channels did with direct visits removed from the credit split. See traffic options.
- Build Twilio Segment audiences from the new traits, like everyone whose first touchpoint was the new channel and who hasn't converted yet.
- Land the result in your warehouse next to spend for a lift-adjusted ROAS.
You may already be reading the Attribution dashboard on its own. Here's what the bidirectional setup adds:
- The dashboard tells you how credit splits across channels. The reverse sync puts the path itself on each customer's profile.
- Dashboard reads are aggregated. Traits on the profile can be used one person at a time, in audiences, journeys, and your CRM.
- Because the reverse sync writes to Twilio Segment, the data reaches every destination you already have connected, with no extra pipeline.
Setting it up
Step 1: Lock a baseline
On the Attribution dashboard, set the Conversion Event to your purchase or SQL event, the Attribution Model to Linear, and Traffic options to Include all Traffic. Open the view options dropdown under the conversion event and click Apply & Save, or create a new view from the current settings. Give it a clear name like "Lift – Include all Traffic", since views are shared with everyone on the project.
Next, set the date range to the four weeks before launch with weekly granularity and record Organic and Direct conversions for each week. Then do the same for the same weeks last year.
Step 2: Launch with tracked links
Connect the new ad platform in Attribution. If there's no native integration, bring spend in through a partner like StackAdapt, the API, or a CSV upload, or add it manually in Attribution, so the channel shows up with cost next to everything else.
Then tag every link you control with UTM parameters: ad destinations, social bios, podcast vanity URLs, and QR codes. Untagged links land in Direct and blur the read. If the channel is TV or radio, send your spot logs to Attribution as each flight runs.
Step 3: Pull assisted lift
Open the Paths report. Set Channel Filter to the new channel, Labels to Channels and Repeat Touchpoints to Combine. Channel Filter keeps every path that touched the new channel anywhere, and Combine merges back-to-back visits from the same channel into one touchpoint.
Now read the paths that start on the new channel and end on Organic or Direct, such as TikTok → Organic → Direct. Those are conversions the new channel started and Organic or Direct closed. Paths where the new channel sits in the middle are assists too.
A channel can have several filters underneath it, like campaigns or creatives. Switch Labels to Filters to see which ones are starting these journeys. To work with individual visitors, open the Individual Paths tab and click Download CSV.
Step 4: Compare against the baseline
Back on the dashboard, using the same view, set the date range to the weeks since launch and compare Organic plus Direct conversions against your baseline weeks and against last year. The number to report each week:
Lift = (Organic + Direct) after launch − (Organic + Direct) baselineThen run a second comparison. Switch Traffic options to Exclude all Direct Traffic and click Apply, which tries the setting without changing your saved view. Direct visits no longer get credit, so that credit shifts to the tracked touchpoints earlier in each path. Compare the new channel's conversions and ROAS under both settings. If its share grows noticeably after you remove Direct, the channel is regularly starting journeys that close on a direct visit.
Prefer to ask in plain English? Connect Claude to Attribution through the Attribution MCP server and ask it something like "Compare Organic and Direct conversions for the four weeks since launch against the four weeks before, and against the same weeks last year." Claude pulls both periods from your dashboard and shows the change for each channel, so you can run this comparison every week without rebuilding it.
Step 5: Send the journey back to Twilio Segment
In Attribution, go to Settings > Conversion Integration and open Segment Reverse - Identity. Select AttributionApp + Segment reverse integration and enter your Twilio Segment write key. Choose the lift view you saved in Step 1. Attribution calculates traits from that view's settings, so purchase traits count your conversion event, whether it's a purchase or an SQL.
Next, select the traits to send: First Touch Channel Name, Last Touch filter name, Last Touch Time, Customer Path, Purchase Count, and First Purchase. Send them for visitors with a user ID only. Turn on the dry run first to validate the exact trait keys before anything is sent.
Each night, Attribution sends an identify call for every visitor whose traits changed. Messages are marked so they don't flow back into Attribution. Keep in mind that this volume counts toward your Twilio Segment plan, and that traits start from the day you turn the sync on.
Once the first sync runs, open a profile in Twilio Segment and you should see the atb_ traits on it, with the full path from first touchpoint to last.
Step 6 (optional): Build the weekly lift table
If you have a Twilio Segment warehouse destination, every identify call also lands in your warehouse. Twilio Segment writes two tables you'll care about: users, which holds only the latest traits for each person, and identifies, which keeps every update with a timestamp. Use identifies for a weekly history. The query below finds the first update after each person's first conversion, which is a snapshot of their path at the moment they converted, and counts the ones that closed on Organic or Direct.
SQL (Snowflake / Redshift)
-- Weekly organic + direct conversions, split by new-channel involvement.
-- Reads the identifies table, which keeps every nightly update with a timestamp.
-- Replace your_source with your Twilio Segment source schema, and 'tiktok' with your
-- new channel's name as it appears in Attribution.
-- Column names follow your atb_ trait keys; confirm them with the dry run.
with first_conversion as (
  select
    user_id,
    received_at,
    atb_first_touch_channel_name,
    atb_customer_path,
    atb_last_touch_filter_name,
    row_number() over (partition by user_id order by received_at) as rn
  from your_source.identifies
  where user_id is not null
    and atb_purchase_count >= 1
)
select
  date_trunc('week', received_at) as week,
  count(*) as organic_direct_conversions,
  sum(case when lower(atb_first_touch_channel_name) = 'tiktok'
           then 1 else 0 end) as first_touch_new_channel,
  sum(case when lower(atb_customer_path) like '%tiktok%'
           then 1 else 0 end) as new_channel_in_path
from first_conversion
where rn = 1
  -- use the filter names your project shows for Organic and Direct
  and atb_last_touch_filter_name in ('Organic', 'Direct')
group by 1
order by 1;
On BigQuery, replace date_trunc('week', received_at) with DATE_TRUNC(DATE(received_at), WEEK). The rest runs as written. Because the sync runs nightly, each conversion lands in the warehouse within about a day of when it happened.
The three columns line up with the two reads: first_touch_new_channel and new_channel_in_path are your assisted lift, and organic_direct_conversions is the total to compare against your baseline. Join the result to your spend table by week for a lift-adjusted ROAS.
What to do next
Now you should have a weekly read on how much a new channel lifts organic and direct, and every customer's journey from first touchpoint to last sitting on their Twilio Segment profile. Treat it as a directional read. For a causal answer, pause the new channel in one region for two weeks and compare that region's organic and direct volume to the rest. Once the table is running, connect an AI assistant through the Attribution MCP server and have it run the weekly comparison for you. We can't wait to see what your next launch actually does for organic and direct.

