
PPC marketing is usually a quantitative practice. Without tracking or measuring PPC campaigns, you won’t know what’s going on. To track, analyze, and present paid advertising performance, you need PPC reporting.
In this guide, we’ll give you all the information you need to know to understand:
- What metrics you should be tracking in your PPC campaigns.
- Common PPC reporting tools (free and paid).
- Best practices for reporting.
- How to troubleshoot problems.
Key Takeaways
- Standardize tracking to avoid data gaps. Use consistent UTM parameters, auto-tagging tools, and a documented naming convention to keep data clean.
- Build a unified dashboard that reflects funnel and channel context. Organize reports by campaign, channel, and funnel stage with a clear visual hierarchy.
- Use real-time reporting and attribution insights to optimize proactively. Use tools like The Attribution Platform to detect cross-channel synergies, track true ROI, and reallocate budget with confidence.
Essential PPC Metrics Every Marketer Should Track
Not every PPC campaign aims for the same result. It’s important to understand the right metrics to track based on your campaign objectives.
If your goal is to build brand awareness, you might focus on ad impressions, reach, or click-through rates. If your goal is to convert customers, focus on conversion rates. Tracking and measuring these metrics helps find optimization opportunities and leverage what’s working best.
Let’s take a look at some of the more important metrics you’ll want to keep your eye on.
Click-Based Metrics
Click-based metrics are self-explanatory—they’re metrics you measure based on click-triggered activities. Two important click-based metrics in PPC reporting are CPC and CTR:
Cost Per Click (CPC)
Cost Per Click refers to how much you (the advertiser) pay a publisher (e.g., Google Search or a media publisher) for each ad click.
You calculate your average CPC by:
CPC = Total Cost of Clicks / Total Number of Clicks
You set a maximum CPC bid—the highest you’re willing to pay per click. Then it puts your bid into an auction to determine your actual payment.
A lower CPC means a cheaper campaign overall with well-optimized, relevant ads. Unless you’re competing for high-value keywords, higher CPC can indicate poorly targeted or irrelevant ads.
According to data from WordStream, the industries with the highest CPC rates are:
- Attorneys and Legal Services ($8.94)
- Home and Home Improvement ($6.96)
- Dentists and Dental Services ($6.82)
Industries with the lowest CPC rates include:
- Arts and Entertainment ($1.72)
- Travel ($1.92)
- Real Estate ($2.10)
Click-Through Rate (CTR)
Your Click-Through Rate is the percentage of people who see your PPC ad (impressions) and click on it. Here’s how to calculate it:
CTR = (Number of Clicks / Number of Impressions) x 100
A high CTR indicates your ad is engaging and relevant to your target audience. It also has an influence on your Ad Rank and Quality Score for Google Ads, which affect ad placement and cost. A low CTR tells you that your ad is not engaging or relevant.
Industries with high average CTRs from WordStream’s data report include:
- Arts and Entertainment (13.04%)
- Travel (10.16%)
- Sports and Recreation (9.66%)
Industries with the lowest average CTR mirror those with the highest CPC:
- Attorneys and Legal Services (5.30%)
- Dentists and Dental Services (5.38%)
- Home and Home Improvement (5.59%)
Both metrics should give you a basic impression of your ads’ performance. If your ads aren’t engaging enough, adjust the copy or creative and use A/B tests to find the best combination.
Conversion Metrics
To convert ad viewers into leads and customers, track and measure conversion-related metrics. Two important metrics are CPA and Conversion Rate.
Cost Per Acquisition/Action (CPA)
Your Cost Per Acquisition (or Action) refers to the total costs of acquiring a specific action, like a lead, demo, sign-up, or sale. It’s not the same as CPC, because you’re measuring users who take a predefined action, not just traffic. Here’s a quick comparison:
- You spend $100 for 200 ad clicks, so your CPC is $0.50.
- The $100 ad gets you 10 purchases, so your CPA is $10.
The CPA calculation formula is straightforward:
CPA = Total Ad Spend / Number of Conversions
In the $100 ad spend example, this metric shows one purchase for every 20 clicks. To increase conversions, you’ll want to make that gap smaller—i.e., fewer clicks to purchase.
WordStream’s report covers CPA and suggests industries with high average CPAs include:
- Technology ($133.52)
- Real Estate ($116.61)
- B2B ($116.13)
Industries with lower average CPAs include:
- Automotive ($33.52)
- Travel and Hospitality ($44.73)
- E-Commerce ($45.27)
If your CPA is higher than average for your industry (but your ads are still getting clicks), your landing page likely needs work rather than the ad, or you need to adjust your audience targeting using lookalike audiences or retargeting.
Conversion Rate
Conversion rates refer to the percentage of visitors who took a desired action (converted into customers or leads). The calculation is simple:
CR = (Conversions / Clicks or Visitors) x 100
Conversion rate is similar to CPA, but there are key differences:
- CPA measures the cost efficiency of a conversion. The unit of measurement is currency, with lower values being better.
- Conversion rate measures the effectiveness of turning traffic into results. It’s a percentage, and higher is better.
The two metrics are directly related. If you increase your conversion rate, your CPA will decrease (unless you’re in a competitive PPC auction). In the same WordStream report, industries with higher average conversion rates include:
- Dating and Personals (9.64%)
- Legal Services (6.98%)
- Consumer Services (6.64%)
Industries with lower average conversion rates include:
- Advocacy/Non-Profit (1.96%)
- Real Estate (2.47%)
- Home Goods (2.70%)
If your conversion rates are low, the problem is likely your landing page or audience targeting. Try A/B testing your landing page copy and creatives, or adjusting your target audience.
Revenue Metrics
Regardless of your PPC campaigns’ immediate goals, the overarching goals should relate to your business revenue. If your PPC campaigns aren’t contributing positive revenue, there’s little point in running them.
Important PPC revenue metrics include ROAS, ROI, and CAC.
Return On Ad Spend (ROAS)
Your Return On Ad Spend refers to the revenue generated for each dollar (or your currency) spent on the campaign. The formula is simple, like the other metrics:
ROAS = Total Revenue / Total Ad Spend (result: 1)
Your result will be a ratio or decimal figure—for example:
- Ad spend: $500
- Campaign revenue = $2000
- ROAS is $2000 / 500 = 4.0 or 4:1.
A high ROAS tells you your campaign effectively generates revenue. A ROAS of 1.0/1:1 means you’re breaking even, and if it’s less than 1.0:1:1, you’re losing money on ads.
It’s important to note that ROAS doesn’t account for profit margins. If you sell a product for $100 but it costs you $80 to fulfill, a ROAS of 1.5 can still mean you’re losing money.
Return on Investment (ROI)
Return on Investment is similar to ROAS, but the metrics tell different stories. ROAS shows how effective your ads are, while PPC ROI shows if you’re making money. The ROI formula is:
ROI = (Revenue – Costs) / Costs x 100
This measurement outputs a percentage and helps you evaluate actual business gain from your PPC campaigns.
Using the same example above:
- Profit = $2000 – ($500 ad spend + $1,200 cost of goods sold) = $300.
- ROI = ($300 / $1700) x 100 = 17.6%.
Like ROAS, the higher the ROI of your campaigns, the better.
Customer Acquisition Cost (CAC)
The last metric is Customer Acquisition Cost, which measures the total cost of acquiring a paying customer. While CPA measures the cost of specific actions, CAC includes all sales and marketing costs, not just ad spend.
The CAC formula is:
CAC = (Sales + Marketing Costs) / New Customers Acquired
This measurement is for high-level business strategy to assess profitability and sustainability. The lower the CAC the better.
Here’s a quick example:
If you spent $10,000 on salaries, tools, and ad spend, and got 100 new paying customers in the measuring period, your CAC would be $100.
It’s wise to measure your CAC against your Customer Lifetime Value (LTV or CLV) in a LTV:CAC ratio. This insight will tell you how valuable a customer is compared to how much you spent to get them. If your LTV is much higher than your CAC, you can scale up, reinvest, or boost acquisition efforts.
Calculating revenue metrics accurately can be tricky. You have to track multiple channels, check for duplicate conversion data, and consolidate it for meaningful results.
The simplest approach is to set up consistent source-level tracking with UTM parameters and bring those into a unified multi-touch attribution software like The Attribution Platform.
PPC Reporting Tools: Free and Paid Options
Most businesses have unique reporting needs. Factors like campaign complexity, budget, and product or service range can have an impact.
With the right tools, you can save time (and money) and gain deeper insights than analyzing your data manually.
We’ll provide a quick overview of common free and paid PPC reporting tools next.
Free PPC Reporting Platforms
We’ll start with the free options: Google Looker Studio and platform-native reporting.
If you use a single marketing channel, native platform reporting, like Facebook Ads Manager or Shopify’s analytics dashboards, would be all you need to use. Once you add more PPC and Paid channels, you’ll need to unify your data.
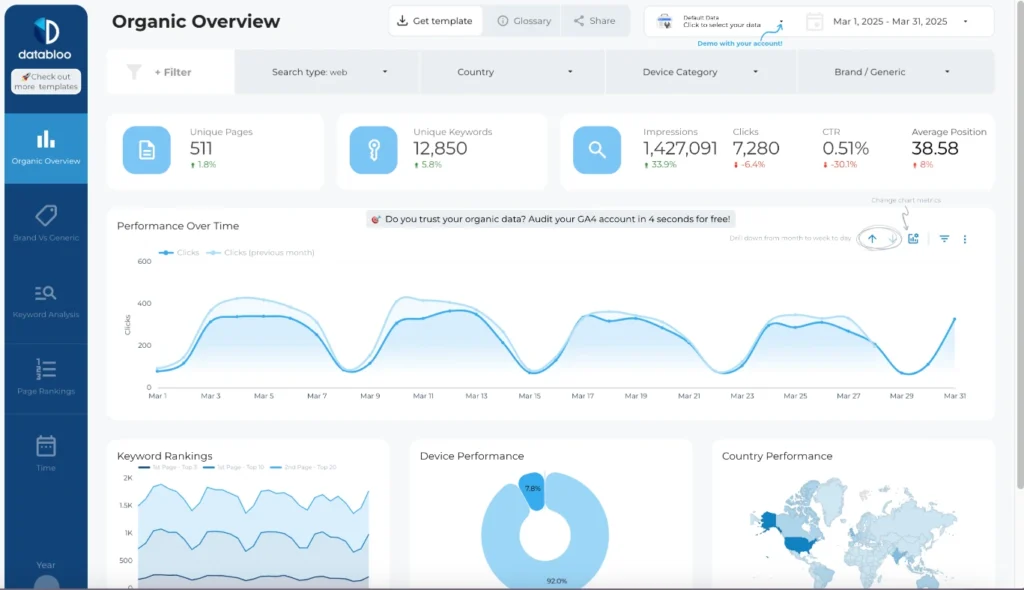
Google Looker Studio is a free data visualization tool that connects and unifies data sources like GA4, Google Ads, BigQuery, spreadsheets, and more. You build customized dashboards using its drag-and-drop UI, and automatically recreate reports each month. Here’s a custom dashboard example:
The platform has over a thousand connectors, so you’ll likely find and connect the data sources you need within Looker Studio. But it’s worth mentioning that third-party connectors aren’t usually free.
The main downside of Google Looker Studio is that free reporting is limited to Google’s products. You’re limited to basic reporting unless you use paid integrations or workarounds (like using Google Sheets as an intermediary).
Paid PPC Reporting Solutions
If your PPC campaign strategy is complex, budget for a paid PPC reporting solution. Three trusted options are Funnel.io, Supermetrics, and The Attribution Platform.
The Attribution Platform
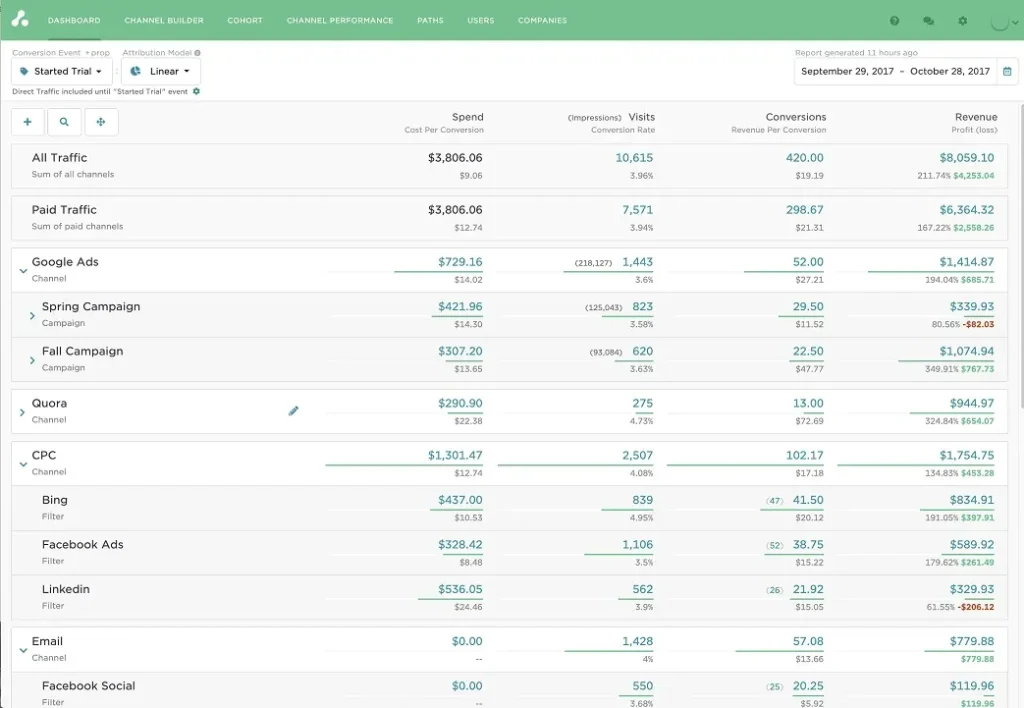
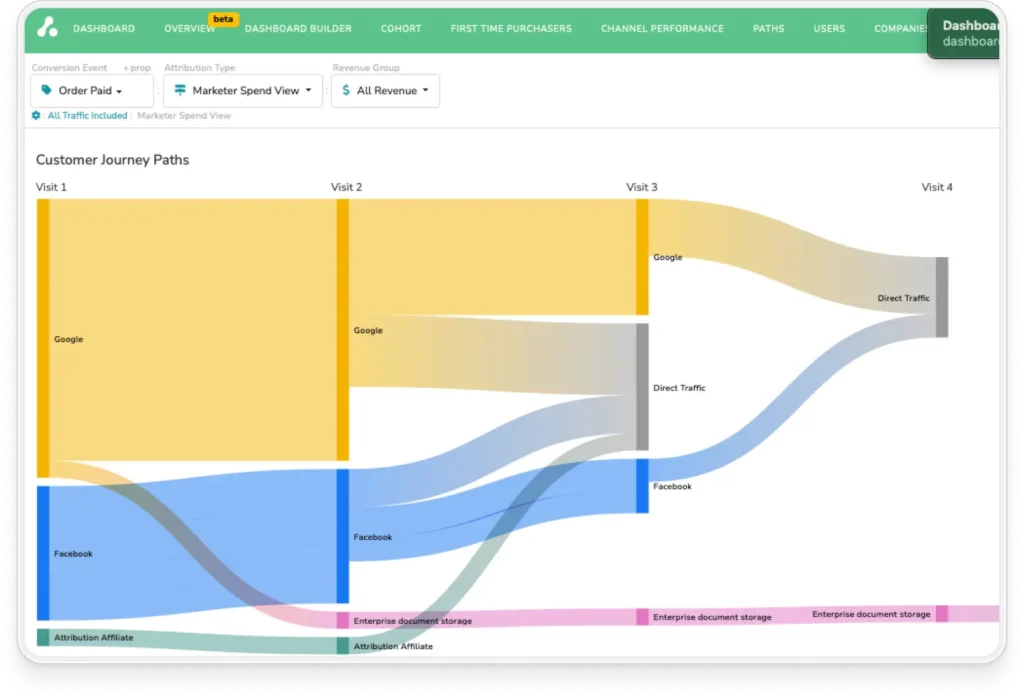
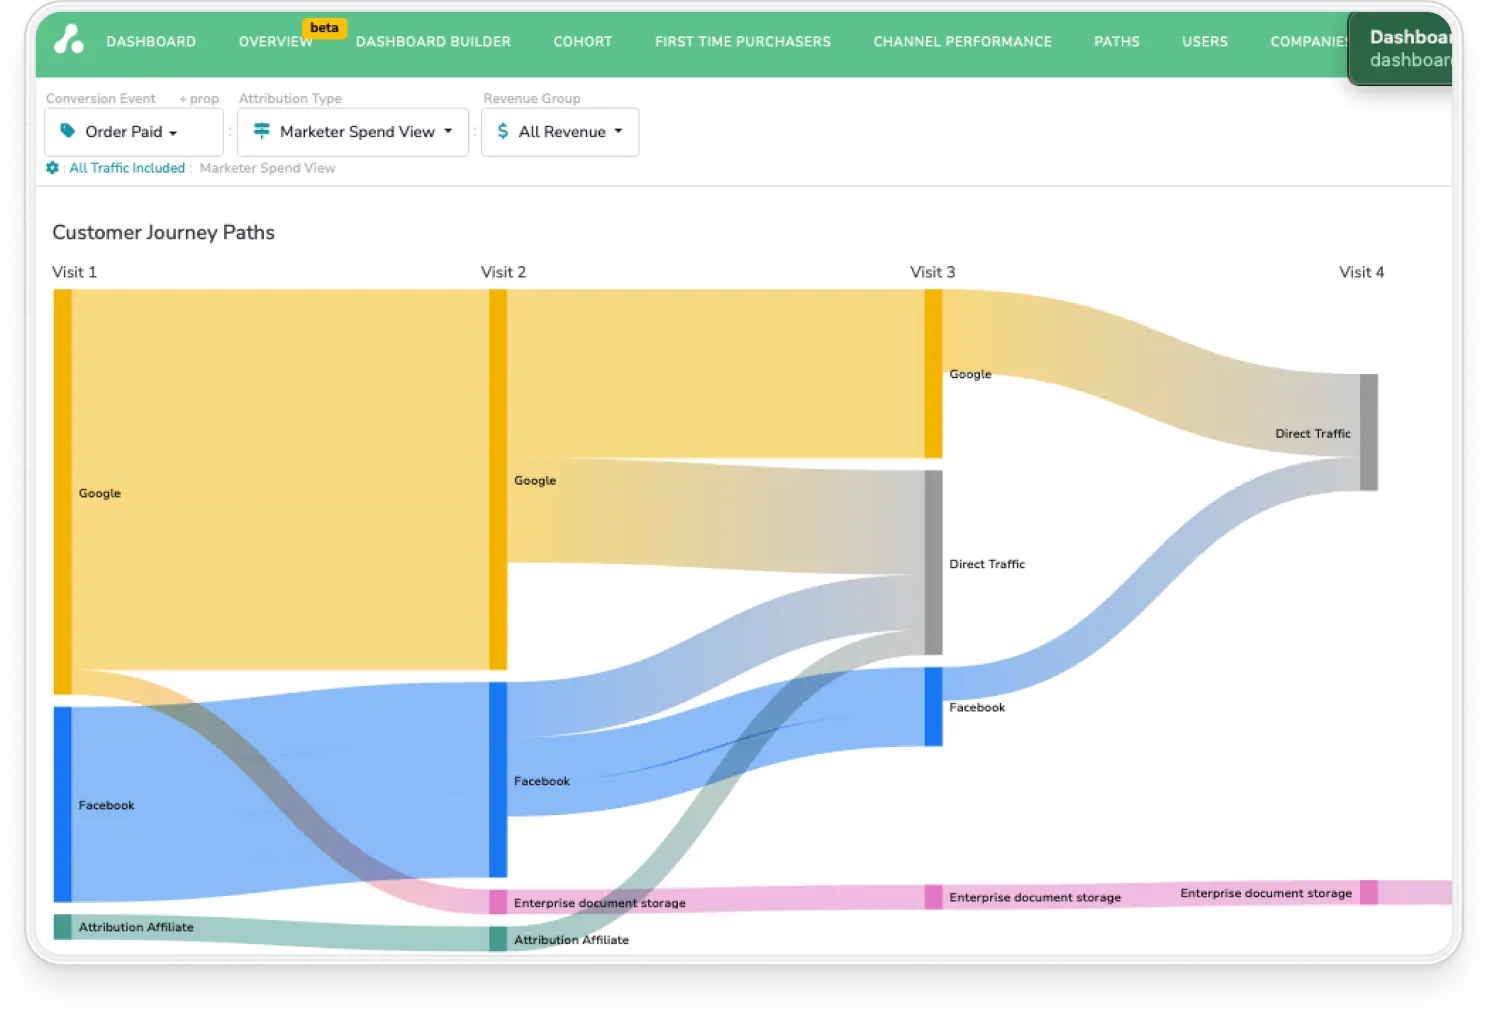
The Attribution Platform is a multi-touch attribution platform that unifies data from from CRMs, CDPs, ad platforms, and other marketing tools into a single dashboard, allowing you to measure the impact of different touchpoints on revenue and conversions.
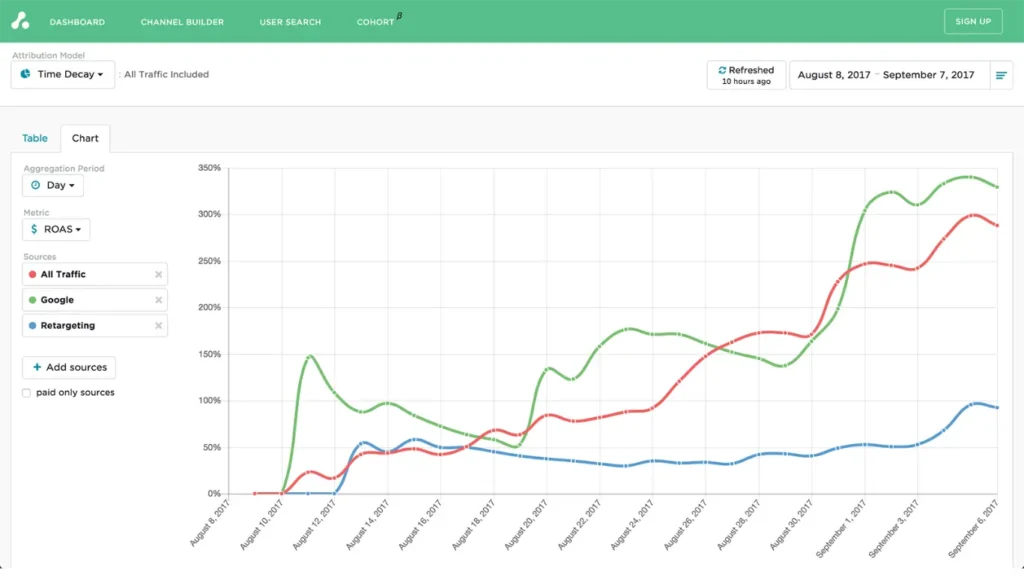
Unlike other tools, The Attribution Platform offers built-in data dashboards with CSV exports and multiple attribution models like first and last-click, linear, time-decay, and custom modeling.
The Attribution Platform lets you easily see your PPC data trends using simple integrations with your data sources. You can also compare the ROI, ROAS, CAC, LTV, and more across multiple channels to see which platforms work best for your brand. Finally, Attribution enables you to aggregate paid and organic channel data, so you can get a complete and auditable view of marketing spend ROI across all channels and platforms.
Book a Demo
Understand the precise impact of each marketing touchpoint and track “true” CAC, ROAS, and ROI on marketing spend with The Attribution Platform.
Supermetrics
Supermetrics is a marketing intelligence platform for data extraction and loading for reporting into other destination tools and a main paid data connector for Google Looker Studio.
Since connecting data integrations is its main solution, it does this seamlessly. The main downside is limited data transformation capabilities, relying on Looker Studio, Microsoft Excel, or Sheets.
Supermetrics pricing has a four-tier subscription model:
- Starter—3 data sources, 1 user, from €29/month.
- Growth—7 data sources, 2 users, from €159/month.
- Pro—10 data sources, 3 users, from €399/month.
- Business—Custom quote.
Each tier (besides business) supports one core data destination. To use more than one, you’ll need to pay extra.
Funnel.io
Funnel.io offers extensive data connectors like Supermetrics, along with data transformation features for a unified data model across platforms, and sending data to tools like Looker Studio.
As a business intelligence tool, it isn’t specific to digital marketing use-cases. This might mean a steeper learning curve for marketers because of its comprehensive BI features.
Funnel.io’s pricing structure is a little confusing. It uses a credit-based system called “flexpoints,” and different features require different amounts:
- Connectors: 50
- Data sources: 5
- Funnel dashboards: 150
- Visualization destinations: 150
- Data warehouse destinations: 300
- Conversion APIs: 50
There are tiers based on your flexpoints usage:
- Free plan—you get 400 flexpoints to use for free.
- Starter—starts from 500 flexpoints, for a limited number of connectors, dashboards, etc.
- Business—same as Starter, but access to more connectors, integrations, etc.
- Enterprise—custom capacity.
You only pay for what you use, but the credit-based system may not suit marketers wanting a straightforward, predictable expense.
Best Practices for Effective PPC Reports
Now you know what key metrics to track and tools to keep your data organized, let’s look at best practices for building effective reports.
How to Organize Your Reports
Here are four tips for organizing your PPC reports for maximum usefulness:
- Structure your PPC dashboard by campaign, channel, and funnel stage to reflect user movement from awareness to conversion.
- Use consistent time periods and comparison ranges (e.g., week-over-week or month-over-month) to spot trends and performance shifts.
- Apply visual hierarchy by placing high-impact metrics (like ROAS or CPA) at the top and supporting data below. Group related metrics to improve scannability.
- Use color cues, summaries, or annotations to highlight key insights and action items so stakeholders can quickly understand what’s working, what’s not, and what to do next.
Keep it clean, focused, and actionable.
How to Nail Your Visuals
When visualizing your data, choose the right chart types for each metric. Bar charts are best for comparing ROAS across campaigns, while line graphs show trends over time like click-through rates or spend.
Avoid overwhelming stakeholders by using filters and controls to let them explore specific channels, campaigns, or date ranges. Add drill-down capabilities for users to click into high-level metrics for deeper insights without cluttering the main view.
Effective PPC dashboards typically use a top-to-bottom layout: KPIs at the top, trends in the middle, and detailed tables or insights at the bottom. Keep it interactive, focused, and easy to interpret.
How Frequently to Report and Which Timeframes to Cover
Choose a reporting cadence that aligns with your goals. Daily reports are for quick optimizations, weekly for campaign pacing, and monthly or quarterly for strategic insights.
MoM, QoQ, or YoY comparisons can help you evaluate performance in context and uncover patterns. However, some metrics are more volatile. Apply rolling averages to smooth out short-term fluctuations in metrics like CPC, while fixed timeframes are better for performance snapshots.
Balance real-time visibility and long-term trend analysis. Timely insights help you act quickly, but meaningful decisions rely on broader performance trends.
Get More Accurate PPC Reporting with The Attribution Platform
Comprehensive PPC reporting is essential for optimizing performance, uncovering insights, and proving the value of your marketing efforts. When done right, it connects day-to-day campaign activity to real business outcomes.
Unified, real-time dashboards across channels make it easier to spot trends, adjust spend, and drive ROI. Tools like The Attribution Platform simplify this process—eliminating manual data entry and helping you make faster, smarter decisions.
Sign up and try Attribution today — pinpoint CAC by channel, audit funnels and conversion rates, scale revenue-driven content marketing, measure affiliate LTV and CAC (and more).
PPC Reporting FAQs
What is PPC reporting?
PPC reporting is a method of tracking, analyzing, and presenting paid advertising performance data.
How often should I update my PPC reports?
It depends on your goals and metrics. Some metrics like impressions, CPA, and CTR need real-time tracking for agile optimization. Others like ROI and CAC are fine to monitor monthly or quarterly.
How do I handle inconsistent or missing UTM parameters?
Create a clear UTM structure for every campaign. Avoid spaces, uppercase letters, or inconsistent separators. Otherwise, automate with auto-tagging or use templates/builders.
What’s the best way to report on PPC performance across multiple products or services?
Segment campaigns by product/service, use consistent KPIs, and build filtered dashboards or tailored reports. This gives you insight into individual performance and the broader portfolio.