Software as a Service (SaaS) customer journeys are a little different compared to standard B2B or B2C customer journeys. Why? SaaS-based companies typically use a subscription or recurring revenue model, and the sales cycles tend to be longer.
Both of these differences come with common challenges SaaS teams face: mapping a SaaS customer journey and connecting marketing efforts to product usage, retention outcomes, and ROI.
In this guide, we’ll cover the need-to-know details of what a typical SaaS customer journey looks like and how to track the journey accurately. We’ll also detail how to combine product usage and marketing data for deeper insights, and using ABM strategies in your journey mapping.
What is the SaaS Customer Journey?
The SaaS customer journey is the complete path a customer takes from their first discovery of your software through becoming a loyal advocate for your brand.
The recurring subscription model separates SaaS from other types of customer journeys. And a typical SaaS funnel is shaped by key milestones like free trials, actual product usage, and subscription renewals.
Within SaaS journeys, customers must continually see value in the product to stay subscribed and engaged. This makes tracking the ongoing customer relationship critical for both retention and growth.
The challenge that SaaS teams tend to encounter is how to track and measure the journey and ongoing relationship — including which metrics and SaaS analytics tools to use. Traditional single-touch attribution models, like first-touch or last-touch, often fail to capture the complexity of SaaS purchase decisions—especially in the B2B enterprise space.
Companies can use SaaS customer journey mapping and multi-touch attribution to fully understand what drives a customer from one stage to the next. This method helps to capture each high-impact touchpoint a customer has over time as they evaluate, buy, and use the software.
Book a Demo
Understand the precise impact of each marketing touchpoint and track “true” CAC, ROAS, and ROI on marketing spend with The Attribution Platform.
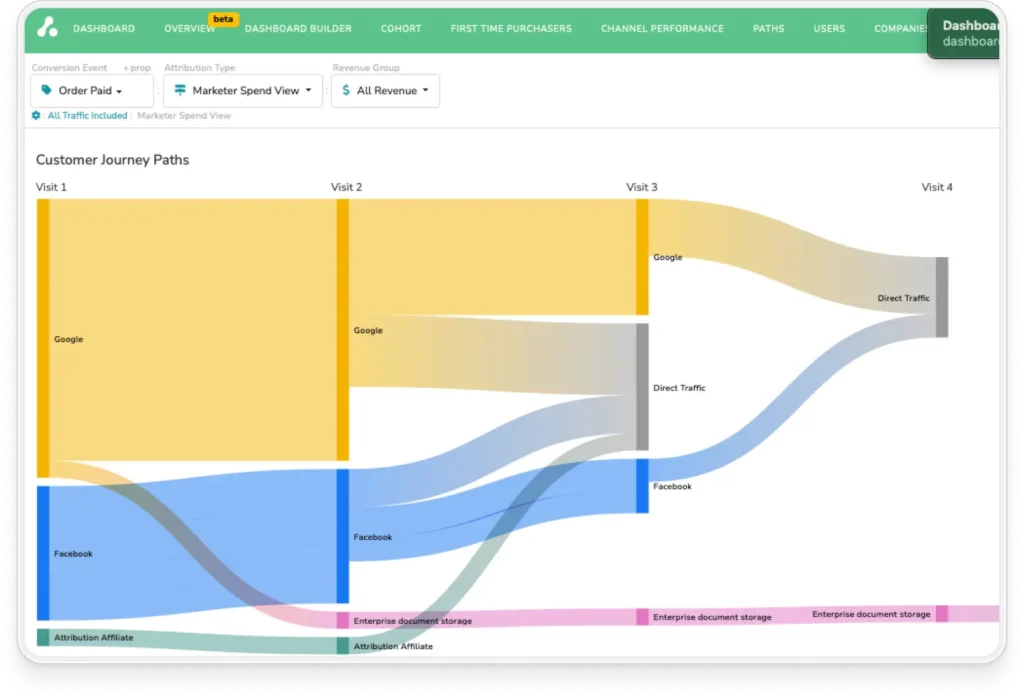
Mapping the SaaS Customer Journey: Key Stages and Touchpoints
Mapping the SaaS customer journey is essential for finding opportunities to optimize marketing efforts and measure ROI. By documenting each stage from awareness to conversion and beyond, you can pinpoint areas for improvement with data-backed evidence.
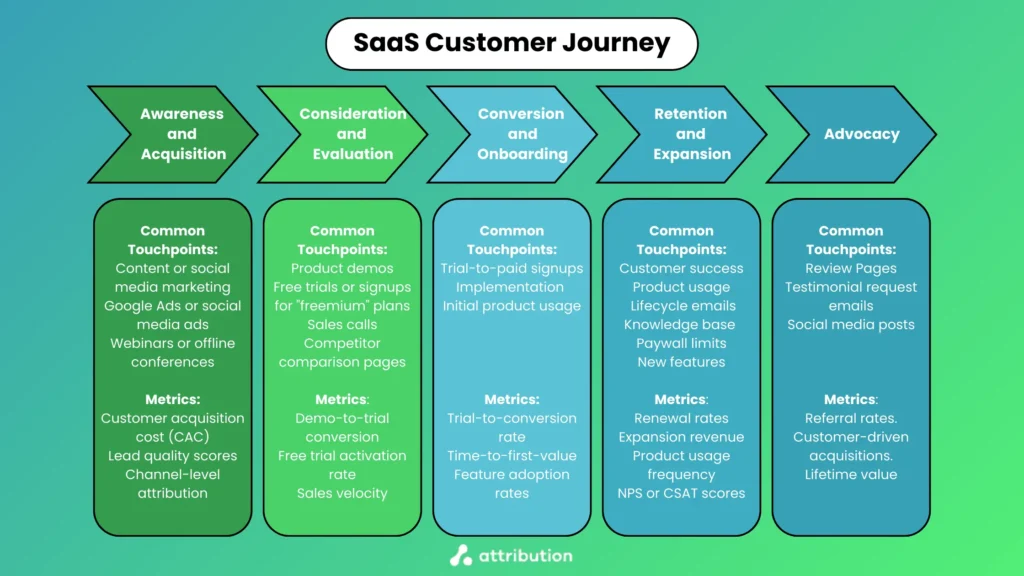
But for SaaS companies in particular, creating a journey map requires both marketing and product data to gain a full view of the customer journey through the following key stages and touchpoints.
Awareness and Acquisition Stage
The awareness and acquisition stage, otherwise known as the “top of the funnel”, is when customers will be just finding out about your product as a first touchpoint.
Some common marketing activities that lead to this first touchpoint include:
- Content or social media marketing (e.g., blog posts, social posts, YouTube videos).
- Google Ads or social media ads.
- Webinars or offline conferences.
The main challenge in this stage is following along with first-touch since leads tend start long research periods and there are typically multiple decision-makers involved.
To measure this part of the customer journey, you’ll want to track the following metrics:
- Customer acquisition cost (CAC).
- Lead quality scores.
- Channel-level attribution.
One solid tip we have for tracking these early-stage interactions is to use UTM parameters and connect them to a CRM or attribution software early on. These parameters will offer the clearest insight into where leads came from.
Consideration and Evaluation Stage
After leads become aware of your product and have some interest, they’ll typically start on the long consideration and evaluation stage. The bigger the price point, the longer this stage tends to be.
At this stage, potential customers commonly interact with touchpoints that include:
- Product demos.
- Free trials or signups for “freemium” plans.
- Sales calls.
- Competitor comparison pages.
These types of activities help leads determine whether your product meets their needs. To measure activity at these touchpoints, you’ll want to track the following metrics:
- Demo-to-trial conversion.
- Free trial activation rate.
- Sales velocity.
You should look for patterns between pre-trial marketing touchpoints and in-product trial behavior to make the data you collect during this stage even more insightful.
For example, users who engage with educational content from the awareness stage (e.g., “How to use [product] for [use case]”) before watching a demo or signing up for a free plan may end up activating faster or exploring advanced features during their trial.
With these types of insights, you can personalize onboarding, create nuanced marketing segments, or double down on the most activating content.
Conversion and Onboarding Stage
After users have researched your product enough—tried it out, tested use cases, and made the case to key stakeholders, they should move into the conversion and onboarding stage.
At this stage, some of the touchpoints customers should engage in include:
- Trial-to-paid signups.
- Implementation (or white-glove onboarding completion).
- Initial product usage.
Monitoring touchpoint activity here is crucial since these function as the real first impression of being active customers of your product.
Here are some metrics you’ll need to track to measure these activities:
- Trial-to-conversion rate.
- Time-to-first-value.
- Feature adoption rates.
Tracking initial product usage and feature adoption is particularly important because it helps reveal friction points and helps predict retention. For example, customers who don’t adopt key features early tend to have a higher risk of churn.
Retention and Expansion Stage
Earning a customer is great, but retaining them for the long term is even better. The retention and expansion stage is when these customers have settled in with using your product, and they may even start looking for advanced functionality with an account upgrade.
At this stage, some of the common touchpoints customers engage with include:
- Customer success interactions.
- Product usage.
- Automated lifecycle emails
- Knowledge base and self-serve support points.
- In-product paywall limit thresholds.
- New feature announcements.
Retention and expansion are both critical for the long-term sustainability of your SaaS product’s growth. Besides (hopefully) increasing your monthly recurring revenue (MRR), here are some other metrics that will help you predict churn or growth:
- Renewal rates.
- Expansion revenue.
- Product usage frequency.
- NPS or CSAT scores.
For these metrics, the higher the number the better. But another aspect to think about in this stage is tying expansion revenue to marketing or product initiatives. These customers are high-value, and you’ll want to find more like them.
One method you can try is analyzing cohort behavior. You can segment customers based on their expansion actions to find patterns and common touchpoints that lead to upsells or cross-sells.
For example, Attribution’s cohort analysis tool helps you visualize channel performance and trends over time.
Advocacy Stage
If your customers stay happy for a long time, there is a good chance they’ll enter the advocacy stage. In this stage, your loyal customers are referring other leads to your business and offering positive testimonials or creating positive word-of-mouth content online.
Some common touchpoints loyal customers may interact with in this stage include review pages or testimonial request emails and social media posts. Beyond monitoring the same metrics as the previous stage, you’ll also want to track:
- Referral rates.
- Customer-driven acquisitions.
- Lifetime value (Referred vs. Acquired customers).
One of the main challenges SaaS brands face in this stage is measuring and attributing the impact of these customer referrals and testimonials. Here’s how to do it effectively:
- Use trackable referral links or codes. The easiest method is using tools like ReferralCandy or FirstPromoter. Otherwise, you can use custom setups in CRMs like HubSpot or Salesforce.
- UTM parameters for testimonial traffic. If testimonials live on a dedicated page or get reused for ads, use UTM tags to track traffic from these touchpoints. Here’s an example UTM: “utm_source=testimonial&utm_campaign=case_study&utm_content=customer_name”.
- Post-signup surveys. Ask your loyal customers where they came from for self-reported attribution, which can help fill in gaps in analytical data (from niche channels, for example).
These tracking methods are fairly simple, especially if you build a solid data foundation from the start.
How to Build Your Data Foundation to Track the SaaS Customer Journey Accurately
No matter what stage of the SaaS customer journey your users are on, there’s a good chance they’ll be interacting with multiple touchpoints. Without a solid data foundation, you’ll find that your data ends up fragmented across marketing, sales, and product teams.
Traditional web analytics fall short for journey tracking for SaaS brands in particular because SaaS journeys are long and nonlinear and they lack user-level tracking across time.
Here’s what you need to do to build that reliable data foundation.
Connect and Unify Your Data
Start by consolidating data from your CRM, ad platforms, and product analytics into a single, unified view. This enables cross-functional insights—connecting marketing touchpoints with in-product behavior and revenue outcomes.
You can do this by integrating your core tools into a platform like Attribution for advanced marketing attribution data. Tools to keep in mind for integration include CRMs such as HubSpot or Salesforce, ad platforms like Google Ads or Facebook Ads, and product analytics tools like Heap.
For best practice, keep clean data hygiene by using standardized naming conventions for campaigns, lifecycle stages, and product/marketing events.
Unifying your data like this is critical for maintaining consistent customer identification across systems.
Implement Multi-Touch Attribution for SaaS
Attribution models help you understand which touchpoints drive conversions. For SaaS, time-decay (giving more weight to recent interactions) and position-based (emphasizing first and last touch) often work best due to long, multi-step journeys.
It’s also important to capture both online and offline touchpoints, like sales calls or events, by logging them in your CRM and taking advantage of the data integrations we mentioned above.
Don’t overlook product-led influences either. Feature adoption and in-app engagement often play a key role in conversion. A complete view blends both marketing and product signals. In Attribution, you can do this with the Heap integration.
Overcome Common Data Silos and Tracking Gaps
To make sure your data foundation is reliable, you need to keep tabs on potential data silos and tracking gaps. Some typical blind spots in the SaaS journey include post-sales engagement, analytical differences between marketing and product platforms, and a lack of feedback loops from customer success.
The most challenging of these issues is bridging data gaps between marketing platforms and product analytics. Here are some tips to help you:
- Use a Customer Data Platform (CDP) like Segment or RudderStack to unify data streams.
- Integrate CRM (e.g., HubSpot, Salesforce) with product analytics tools to sync user and event data.
- Use UTM parameters and tagging frameworks for consistent lead attribution.
Using UTM parameters is one of the most flexible options, as this will also help you track cross-device and cross-channel customer behavior.
Combine Product Usage and Marketing Data for Deeper Insights
In the previous section, we mentioned using integrations for connecting product engagement with marketing attribution. By using this approach, you’ll gain much more meaningful insights about the full SaaS customer journey compared to treating them separately.
Why? This combined view reveals which marketing efforts drive active product usage and feature adoption. With these insights, you can allocate more resources to the efforts that are driving more engaged users.
Let’s get into the practical steps in more detail.
Identify Which Marketing Channels Drive Active Product Users
Power users are high-value customers, so it’s a good idea to figure out where they originally came from. To do that, you’ll need to have built the data foundation we discussed above. The basic steps for this particular insight are:
- Capture source data at first touch with UTM parameters.
- Assign a unique ID (email or user ID) that persists across sessions and platforms with tools like Segment.
- Track in-product user behavior with product analytics like Heap, and create cohorts or flag power-user behavior.
- Merge source and behavior data, with views like “users from LinkedIn Campaign A had the highest 30-day retention and feature usage.”
- Use an app like Attribution to show both source and downstream behavior to figure out the best balance between efforts driving active users and ROI.
This approach helps you not only track power users, but it also gives you an understanding of the quality of users by acquisition channel. Some other insights this cross-functional approach can give you include:
- Which features the most high-LTV customers use.
- Where users tend to drop off in the journey and from which sources.
- Lead sources linked to higher close rates or faster sales cycles.
- Which onboarding paths correlate with long-term engagement.
And these are just a few examples. You can gain many more from this level of data collection and analysis.
Find Feature Adoption Patterns by Acquisition Source
Using the above step-by-step approach, you’ll also be able to track which marketing efforts lead to adoption of key features.
For example, if you release a new feature and create content for it, you’ll likely find users who adopt the new feature either came from a landing page ad, an informational article, or in-product feature prompts.
The key is using full-funnel journey tracking throughout the customer acquisition funnel to find out which source leads to greater product adoption. This insight can help you optimize your marketing messages around most-used or valuable features, as well as tell your product team which features aren’t providing value.
Predict Churn Risk Based on Combined Signals
One of the extra benefits you get from combining product usage and marketing data is being able to better predict churn risk.
Together, these reveal early warning signs that a user is disengaging. Attribution tools help surface which customer segments are most at risk—like users from a specific campaign or channel with lower activation or retention.
With these insights, you can use proactive retention strategies like re-engagement emails, offer personalized support, or adjust onboarding based on segment behavior. The goal is to intervene before churn happens by recognizing these patterns early.
Incorporate Account-Based Marketing Strategies Into Your SaaS Customer Journey Mapping
When you consider account-based marketing (ABM) strategies, managing and tracking data across the SaaS customer journey map becomes even more important.
The main reason is that there are multiple stakeholders, leading to multi-user journeys under the same account, which you need to aggregate for measurement, attribution, and optimization. Here’s how:
Map Multiple Decision-Makers to a Single Account Journey
Start by using account-matching rules to map decision makers to a single journey. You can do this by grouping contacts by domain, company ID, or a CRM account object (in HubSpot or Salesforce, for example).
From there, you’ll need to use a unique identifier (like “account_id”) across tools (like CRM, marketing automation, product analytics) to tie contacts together. Tools like The Attribution Platform and Segment can ingest individual-level data and aggregate them into the account-level.
An additional factor to consider is how some roles tend to have more sway than others. To attribute this influence, you can assign weighted score engagement by role and intent, for example:
- Executive downloads pricing guide = high influence.
- End-user attends webinar = medium influence.
You can use this type of logic with HubSpot ABM features and run retrospectives on deals to refine a custom role-weighted attribution model over time.
Measure ABM Campaign Effectiveness Throughout the SaaS Funnel
If your SaaS brand uses an ABM strategy, you’ll likely need a slightly different set of metrics to measure across each stage of the customer journey. Here’s a quick overview of those metrics:
- Awareness and acquisition:
- Target account reach.
- Website visits from target accounts.
- Percentage of ICP accounts engaging with content.
- Engagement rate by account
- Consideration and evaluation:
- Number of engaged contacts per account.
- Content downloads or webinar attendance from target accounts.
- Demo requests or pricing page visits.
- Sales development engagement.
- Conversion and onboarding:
- Opportunity creation rate.
- Conversion rate from MQL > SQL > Opportunity.
- Average deal size of ABM accounts.
- Sales cycle length.
- Retention and expansion:
- Product usage depth across roles.
- Account health score.
- Expansion revenue.
- Renewal rate of ABM accounts.
- Net Revenue Retention (NRR).
- Advocacy:
- Referral activity from target accounts.
- Event speaking or co-marketing participation.
- Case study participation.
To be able to attribute account progression with specific ABM tactics, you’ll need to map touchpoints to journey stages as usual. Then, you’ll also need to apply attribution models to aggregated data and analyze which tactics correlate with stage advancement.
Optimize ABM Resource Allocation Based on Attribution Insights
By mapping users across the customer journey at the account level, you’ll be able to gather meaningful attribution insights, which you can use for resource optimization.
One key strategy for resource optimization is figuring out which accounts deserve more investment (and which you can afford to sideline). Here’s one way to find out:
- Define your high-intent engagement signals. For example, multiple contacts engaging, replies to sales outreach, high-value actions like pricing page visits and demo requests.
- Use an account engagement score system. For example, 5 pts for content views, 15pts for webinar attendance, 30pts for demo requests, and 20pts for multiple contacts engaged. HubSpot and Salesforce support this kind of scoring.
- Combine engagement with Fit data. Use firmographic or ICP data (industry, company size, revenue, tech stack, etc.), and overlay engagement. High fit + High engagement = strong candidates for investment.
Here’s a pro tip: flag accounts that show broad engagement (multiple roles and functions). This indicates deeper organizational buy-in and offers strong deal potential.
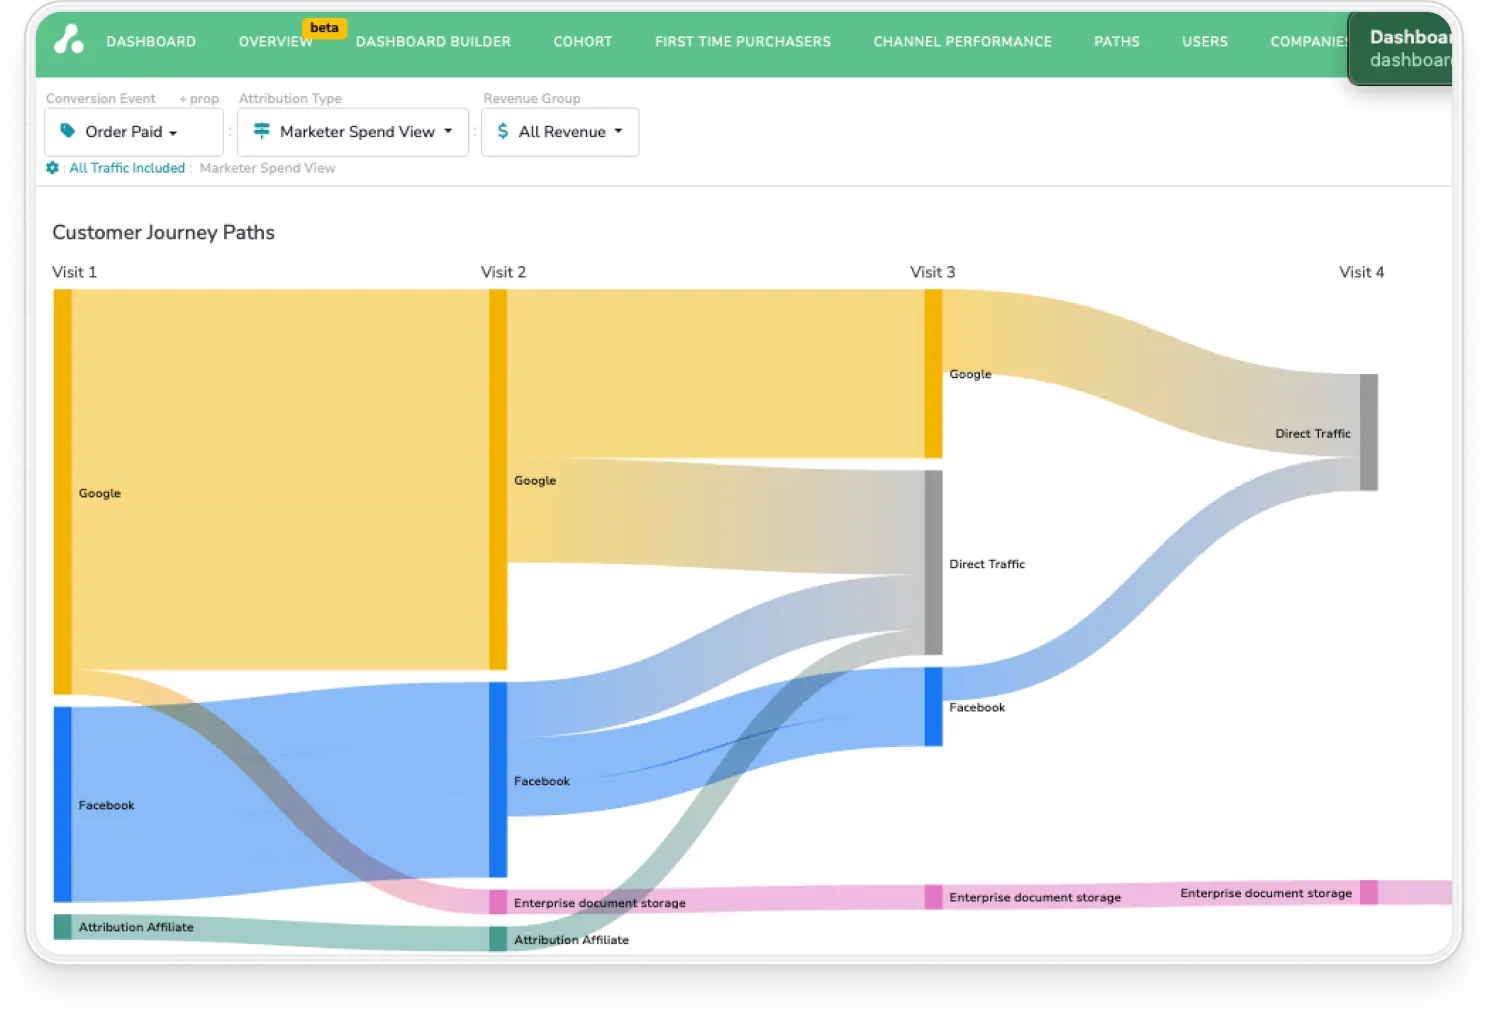
Another strategy for resource allocation is figuring out the most effective touchpoint sequence for target accounts. To do this, analyze historical journeys of converted accounts using multi-touch attribution to identify common patterns.
Look for sequences with high engagement and short time-to-opportunity (e.g., ad > webinar > sales call). Use this data to replicate and test similar sequences with new target accounts to nail your account-based attribution.
How Attribution Provides a Single Source of Truth for the SaaS Customer Journey
We know that SaaS customer journeys can be long and involve multiple stakeholders and touchpoints, especially on B2B accounts.
The Attribution Platform specifically addresses the challenge of tracking and measuring leads and customers through the entire customer journey. It unifies the fragmented data into a single-source-of-truth analytical dashboard.
Seamless Integration with SaaS Marketing and Product Tech Stacks
You can attribute SaaS customers from awareness through to conversion using a mix of UTM parameters and integrations with popular CRM tools like HubSpot, Salesforce; analytics tools like Segment; and the subscription processor Recurly.
With the integration with Heap, you can also track in-product usage and combine this with marketing data for even deeper insights into high-value features and acquisition sources of power users. These integrations mean you’ll eliminate attribution blind spots.
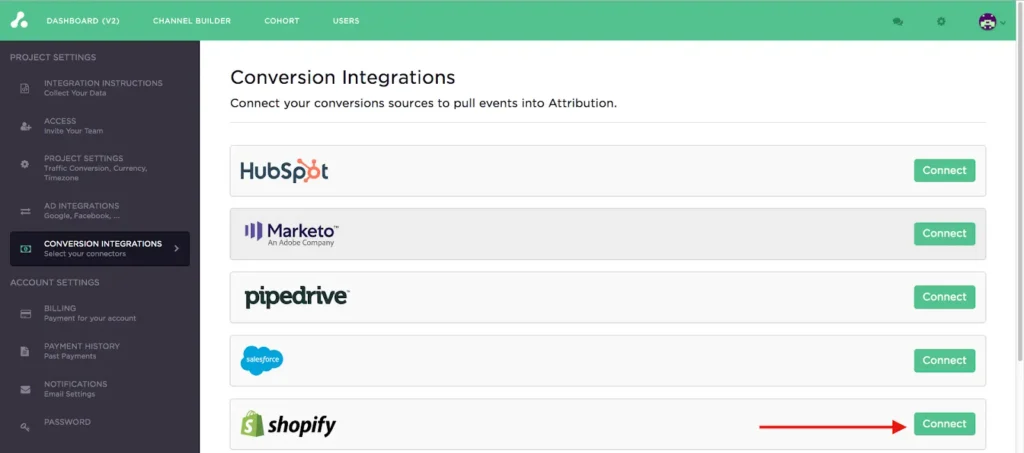
Many of the integrations in Attribution have pre-built connectors, meaning you can sync these tools up in just a few clicks.
Multi-Touch Attribution Models Tailored for SaaS Businesses
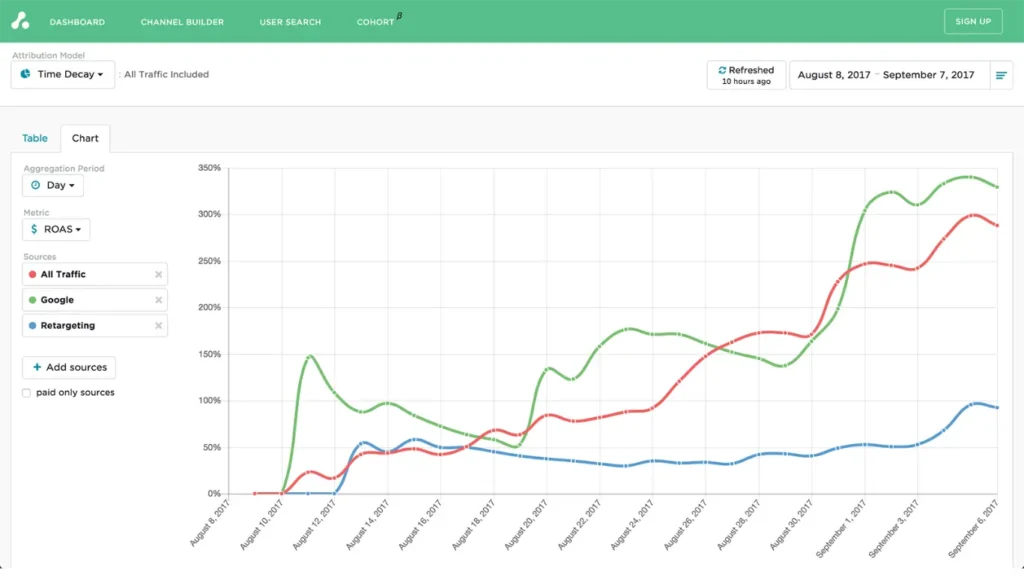
The Attribution Platform offers flexible, multi-touch attribution models that account for SaaS-specific purchase patterns. You can use default modes like position-based or time-decay attribution, or create custom-weighted models that assign revenue credit to each touchpoint depending on weight.
These custom-weighted models are particularly useful for SaaS brands using ABM strategies. You can use them to predict which accounts are ready to convert and which need more nurturing with predictive engagement scores built in.
Real-Time Insights for Agile Optimization
When you can get insights in real-time, data becomes even more useful. The Attribution Platform lets you track several metrics in real-time at a granular level, including:
- Customer acquisition cost (CAC)
- CAC payback
- LTV:CAC
These real-time insights are particularly important for feature launches. With Attribution, you’ll be able to identify which channels are driving qualified product trials and feature adoption immediately. These quick analyses help you optimize your budget allocation across the entire customer journey.
Sign up and try Attribution today — pinpoint CAC by channel, audit funnels and conversion rates, scale revenue-driven content marketing, measure affiliate LTV and CAC (and more).
SaaS Customer journey FAQs
What is SaaS customer journey attribution?
SaaS customer journey attribution is the process of identifying which marketing and product touchpoints influence customer decisions.
How do I begin tracking the SaaS customer journey if I’m just starting out?
The best way to start tracking SaaS customer journeys is by using basic UTM tracking to at least get accurate traffic analytics. Then you can gradually expand to more sophisticated attribution.
What tools are essential for tracking the SaaS customer journey effectively?
Some essential tool categories for tracking SaaS customer journeys are CRMs, marketing automation tools, product analytics tools, and multi-touch attribution platforms.
How is tracking the B2B SaaS customer journey different from B2C SaaS?
B2B SaaS customer journeys are typically different from B2C journeys because they have longer sales cycles and typically involve multiple stakeholders in buying decisions.
Can multi-touch attribution help identify churn risks in the SaaS customer journey?
Yes, you can identify potential drop-off points and proactively re-engage the customer by combining product usage data and marketing engagement data.
How do I integrate offline or third-party event data in a SaaS customer journey?
Start by logging offline interactions in a CRM platform with standardized fields and timestamps. Then, use a Customer Data Platform like Segment or HubSpot to merge this data with digital touchpoints via account or contact IDs.
How often should I review and update my SaaS customer journey map?
You should review journey maps and attribution models at a minimum of a quarterly basis. Any longer and you risk missing timely insights.
