Google Ads makes it easy to spend. Easier to scale. And incredibly hard to measure properly.
The default reporting is built for simplicity, not accuracy. It reports “conversions” that might not generate real revenue. It assigns credit based on the clicks it can see, not the full customer journey. And it completely misses any deal that closes offline, in another tool, or outside a 90-day window.
For marketers serious about profitability, ROAS alone isn’t enough. You need to understand where the gaps are in Google’s model and how to rebuild your performance lens around real outcomes, not just what the ad platform says.
What Is the Difference Between Google Ads ROAS and ROI?
ROAS and ROI are both ways to measure Google Ads performance, but they answer very different questions.
ROAS (Return on Ad Spend) tells you how efficiently your ad dollars generate revenue. It’s the default metric Google Ads shows you: simple, fast, and often misleading.
ROI (Return on Investment) tells you how profitable your campaigns really are. It factors in all the costs—other marketing touchpoints, operations, and overhead—to show whether a campaign actually delivered value.
When you only look at ROAS, you’re measuring efficiency in isolation. When you look at ROI, you’re measuring performance in context.
| Example: E-Commerce ROAS vs. ROI for Google Ads You spend $10,000 on Google Ads and generate $40,000 in revenue. – ROAS = 4.0x – But your costs (COGS, shipping, tech stack) total $35,000. – ROI = (40,000 – 35,000) / 35,000 = 14.3% High ROAS. Low profit. Not a campaign you’d want to scale blindly. |
| Example: Lead Generation ROAS vs. ROI for Google Ads You spend $5,000 on Google Ads and win $50,000 in new business. But it took another $20,000 in supporting programs—LinkedIn Ads, content syndication, retargeting—to get those deals across the line. – ROAS = 10.0x – ROI = (50,000 – 25,000) / 25,000 = 100% In B2B, success often comes from the full funnel. ROI accounts for that. ROAS doesn’t. |
If you’re optimizing inside the Google Ads dashboard, ROAS is useful. But if you’re managing budget across multiple channels or reporting to a CFO, ROI is the number that actually matters.
And the only way to calculate it cleanly is to unify your spend and revenue data across the full journey, not just the last click.
How Google Ads Tracks ROAS and ROI Data
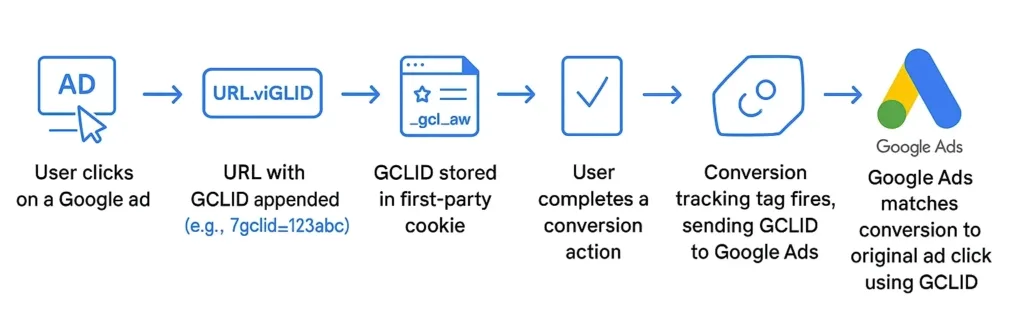
When someone clicks an ad, Google appends a unique GCLID (Google Click ID) to the URL. If your conversion tracking is properly set up—usually through Google Tag Manager or the global site tag—Google can tie that click to a conversion event, like a purchase or form submission. That’s how it calculates ROAS.
But the platform’s view of revenue is limited by what it can track and when it sees it. Here’s why things start to diverge:
- Attribution windows are narrow. Most accounts use a 30- or 90-day window. Conversions outside that range don’t count no matter how valuable.
- Attribution models vary. Google Ads often uses last-click by default. GA4 might use data-driven attribution. Neither tells the full story.
- Conversion timing is mismatched. Google records conversions based on when they’re tracked, not when they actuallyhappen, skewing daily and campaign-level ROAS.
- Cross-platform metrics don’t align. Google Ads shows modeled conversions. GA4 applies different filters and credit rules. Shopify shows revenue that doesn’t match either one. And your CRM might show ROI based on what closed, not what clicked.
Ultimately, you could run one campaign and see three different outcomes:
- Google Ads says ROAS is 6x
- GA4 says ROAS is 3.2x
- Internal data shows total ROI is -10% once other ad spend and actual costs factor in
None of these numbers are “wrong.” They’re just answering different questions with different data sets. The trouble comes when you use one number to make high-stakes decisions like cutting budget, increasing bids, or declaring a campaign a success.
To measure ROAS and ROI accurately, you need more than a GCLID and a conversion pixel. You need unified data across platforms, across time, and across the full buyer journey.
Book a Demo
Understand the precise impact of each marketing touchpoint and track “true” CAC, ROAS, and ROI on marketing spend with The Attribution Platform.
Setting Realistic ROAS and ROI Targets
If you’re setting ROAS targets based on Google’s recommendations (or worse, guessing), you’re flying blind. What looks like strong performance in the dashboard can fall apart once you factor in profit margins, customer acquisition costs, or supporting campaign spend.
Instead of chasing arbitrary numbers, build targets that reflect your actual business economics. That starts with your own data.
Start With a Baseline
Before setting new goals, audit your past campaigns:
- Look at ROAS and ROI for each campaign over the last 3–6 months
- Separate branded and non-branded keywords
- Break out performance by funnel stage, region, and audience if possible
- Identify outliers that pulled overall numbers up or down
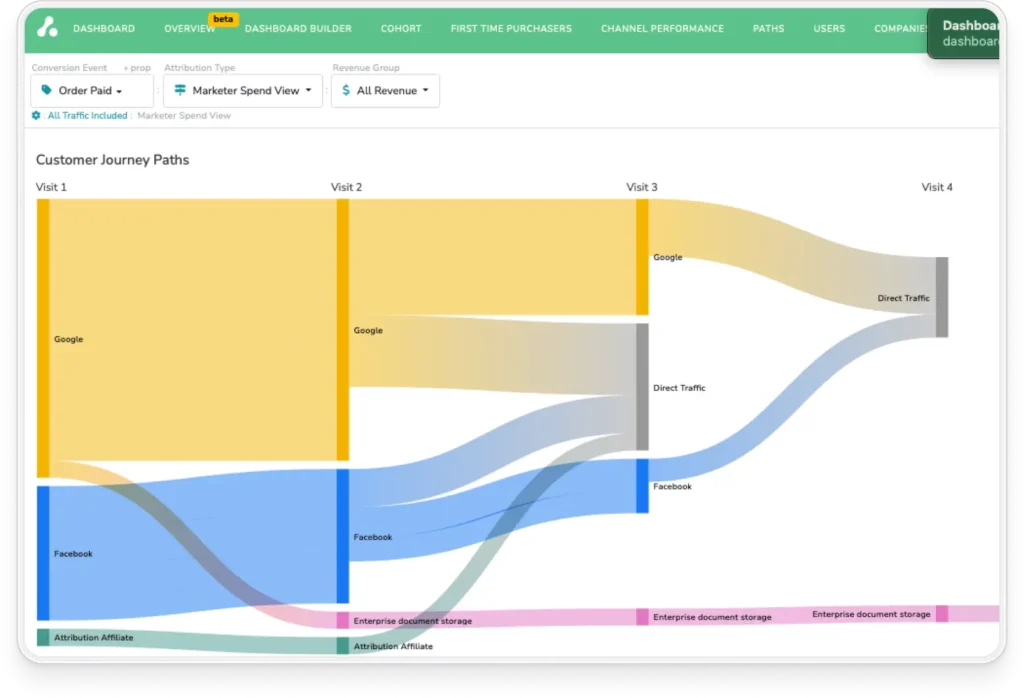
If you’re using The Attribution Platform, you can segment by first-touch vs. last-touch, cross-channel impact, or revenue from offline conversions, all of which offer a clearer picture than platform metrics alone.
Use Industry Benchmarks as Reference
Benchmarks help, but they shouldn’t define success. Based on what we see with customers and across the industry, these are rough rules of thumb you can use as sanity checks.
| Industry | ROAS Guideline |
|---|---|
| E-Commerce | 2.75x |
| DTC | 3.0x to 5.0x |
| B2B | 4.0x to 10.0x depending on sales cycle and conversion value |
Let Profit Margins Set the Floor
To find your break-even ROAS, use this formula:
Break-even ROAS = 1 ÷ Profit Margin
- 50% margin means 2.0 ROAS is breakeven
- 25% margin means 4.0 ROAS just breaks even
- 10% margin means You need a 10.0 ROAS just to stay afloat
If your campaigns are clearing break-even but not hitting your true profit goals, it’s time to raise the bar or trim spend.
Adjust Targets as Campaigns Mature
Not every campaign needs to be profitable on day one. Especially in lead gen and high-LTV businesses, it’s normal to run early campaigns below your long-term ROI goals.
Use a phased approach:
- Phase 1: Learn and qualify. New keywords or audiences. Allow for low or negative ROI. Focus on signals like CTR, conversion quality, and engagement.
- Phase 2: Optimize and refine. Cut waste, improve targeting, test offers and landing pages. ROAS should trend upward.
- Phase 3: Scale and raise targets. Once you’ve hit break-even and stabilized performance, increase volume and push toward ROI-positive scaling.
If you’re working with LTV:CAC models, your targets may vary even more. A 1:1 ROAS might be fine if you know that customer will generate 4x in revenue over time. But that only works if you can track that LTV reliably.
How to Use Your Data to Optimize and Scale Your Google Ads
Getting clear ROAS and ROI data is your first step. But once you have it, the next step is turning insight into action. That means optimizing what’s underperforming, doubling down on what works, and continuously fine-tuning based on the right signals, not just what Google Ads reports by default.
Here’s how to build a smarter, more scalable strategy from the data you already have.
Structure Your Account for Insight, Not Just Delivery
The way your account is organized affects everything from reporting clarity to ad performance.
- Separate branded and non-branded campaigns. Branded keywords almost always drive higher ROAS because they capture people who are already searching for you. Grouping them with non-branded terms inflates your numbers and masks underperforming segments.
- Use tightly themed ad groups. Keep your keywords, ads, and landing pages aligned by intent. Don’t let broad match terms spill across unrelated offers.
- Label and segment by funnel stage. Knowing which campaigns drive awareness vs. conversion helps you set realistic ROAS expectations and avoid optimizing for the wrong outcome.
Test Keywords, Not Just Copy
Keyword selection is one of the biggest levers for ROAS. But most accounts either over-rely on broad match or underutilize negatives.
- Identify and protect your high-intent terms. These usually come from long-tail, specific queries with buying signals (“best B2B CRM for healthcare”).
- Regularly prune with negative keywords. Use the search terms report to block wasteful queries that drain budget without converting.
- Test match types deliberately. Use exact match for precision, broad for discovery, and phrase match to balance the two, but track each one’s performance independently.
Improve the Funnel, Not Just the Ad
Great ads can’t fix a broken landing experience. Optimizing post-click performance is one of the fastest ways to improve ROAS and ROI—especially if your CPCs are high.
- Speed matters. If your page loads in more than 3 seconds, you’re leaking conversions.
- Message match is critical. Make sure the headline and CTA reflect the language used in the ad. Don’t bait-and-switch.
- Use CRO best practices. Clear CTAs, trust indicators, fewer distractions, and mobile-first layouts all contribute to higher conversion rates.
Make sure you track how each landing page or funnel variation contributes to revenue, not just form fills. That helps you avoid false positives and surface your actual top performers.
Optimize Your Bidding Strategy
Google’s Smart Bidding options can work if your data is clean. Otherwise, they’ll optimize toward the wrong signals.
- Start with manual or Target CPA bidding if your Google Analytics conversion tracking is still in flux or includes low-value actions.
- Switch to Target ROAS once you trust the data. But don’t set unrealistic targets. Google will throttle your reach and reduce volume if the bar is too high.
- Test bidding strategies in parallel. Try different bidding approaches across similar campaigns to see which one delivers better ROI over time.
Scale What Works (Without Breaking It)
Scaling isn’t just about increasing budget. It’s about preserving efficiency as you grow.
- Scale incrementally. Don’t double your budget overnight. Increase by 10–20% every few days while monitoring performance.
- Clone and adapt top campaigns. Duplicate what’s working and tweak targeting, creatives, or geo settings. This helps isolate variables without risking your core results.
- Watch for diminishing returns. As you spend more, CPCs often rise and ROAS starts to dip. Use revenue (not just clicks) as your north star.
Troubleshooting a Low or Declining ROAS/ROI
When performance takes a hit, don’t panic and start making changes blindly. Start with a framework. The most common causes of declining results fall into one of five categories:
- Broken tracking. Tags, values, or attribution settings aren’t functioning correctly.
- Conversion funnel leaks. Users click but don’t convert due to page or journey friction.
- Shifts in attribution model. Credit is being reassigned in ways that change reported ROAS.
- Underperforming segments. A specific campaign, keyword, audience, or region is dragging down results.
- External forces. Competition, seasonality, fraud, or ad fatigue are affecting outcomes.
If you’re trying to run a quick triage process when returns suddenly decline, try this checklist.
- Is GCLID tracking intact across URLs and forms?
- Are conversion values firing and passing correctly?
- Did attribution models or conversion settings recently change?
- Has traffic shifted to broader, less targeted queries?
- Is CTR falling, or CPC rising disproportionately?
- Are specific devices, geos, or ad groups underdelivering?
- Are branded campaigns masking poor performance elsewhere?
- Have Auction Insights changed? New competitors in the mix?
- Has there been a creative or landing page change?
- Any signs of click fraud or unusual traffic patterns?
Beyond a quick triage, take the following steps to troubleshoot dips in ROAS and ROI.
Diagnose Conversion Tracking Issues
Many ROAS and ROI drops have nothing to do with performance. They’re often caused by broken or misaligned tracking.
Check whether:
- GCLID parameters are present on all ad URLs and landing pages
- Conversion tags are firing properly, with revenue values attached
- Form submissions or purchases are actually being tied to the original ad click
- The tracked conversions still represent real business value, not just early-stage intent
Also confirm whether your attribution model recently changed. A shift from last-click to data-driven, for example, can cut reported ROAS in half without changing revenue at all.
Identify Underperforming Segments
Once tracking is ruled out, zoom in on the data. A campaign’s average ROAS can hide big differences under the surface.
Segment by:
- Branded vs. non-branded terms. High ROAS from branded searches can inflate your total and mask unprofitable prospecting.
- Match type and keyword intent. Broad match terms often bring in lower-converting traffic unless carefully refined.
- Geography and device. A single region or mobile audience can underperform dramatically compared to desktop or other markets.
- Audience type. New visitors, remarketing, and lookalikes each will have different return profiles.
Look for sudden performance shifts: Has one ad group seen a spike in CPCs? Is one keyword dragging down your blended average?
Address External Factors
Sometimes everything internal looks fine and performance still drops. External forces may be at play.
Start by reviewing:
- Auction Insights. New competitors, higher bids, or lower impression share could signal increased competition.
- Creative fatigue. Falling CTRs are a sign your ads need a refresh.
- Landing page updates. A new layout or slower load time might be tanking your conversion rate.
- Seasonality or buying behavior changes. Are you in an off-cycle month, or has search intent shifted?
- Click fraud or bot traffic. Unusual spikes in low-converting clicks can point to competitor sabotage or network-level abuse.
Use tools like Google Ads' IP exclusions, click fraud detection platforms, or Attribution’s channel-level revenue data to spot and respond to suspicious activity.
Pinpoint True ROAS and ROI on Your Google Ads Campaigns with The Attribution Platform
When you’ve done the work—tightened your campaigns, cleaned up tracking, fixed funnel leaks—and PPC ROI still doesn’t line up with reported results, the problem isn’t your marketing. It’s your measurement.
That’s a problem The Attribution Platform solves.
Unlike platform dashboards that stop at the last click, The Attribution Platform connects Google Ads spend directly to actual revenue. It captures the GCLID from every ad click, maps it to conversions across your funnel, and shows you the true ROAS and ROI of each campaign—no modeling, no guesswork. It does this by providing:
- A unified performance dashboard that shows spend, revenue, ROAS, and ROI across Google Ads and other paid channels.
- Direct GCLID resolution, so you can tie ad clicks to revenue without relying on modeled or sampled data.
- Support for flexible attribution models (first-touch, last-touch, linear, time decay, custom) to match your sales cycle and funnel complexity.
- Native integrations with tools like Segment and major CDPs, ensuring conversion events are accurate and complete across systems.
- Real-time revenue tracking, allowing marketers to optimize campaigns based on actual business impact, not proxy metrics like form fills or modeled conversions.
Livestorm VP of Growth Operations Thibaut Davoult said that these features helped them uncover revenue and cost savings opportunities they “never would have identified without granular visibility into our marketing performance.” And that visibility helped them shift “Google Ads spend toward profitable campaigns.”
Sign up and try Attribution today — pinpoint CAC by channel, audit funnels and conversion rates, scale revenue-driven content marketing, measure affiliate LTV and CAC (and more).
Google Ads ROAS FAQs
How can I recover from sudden ROAS and ROI drops?
Start by checking your tracking setup. Make sure GCLIDs are resolving correctly and conversion values are still being passed. Then look for underperforming segments: campaigns, ad groups, or keywords where CPCs have spiked or conversion rates have dropped. Don’t forget to rule out external factors like seasonality, increased competition, or creative fatigue. A structured diagnostic process will help you pinpoint the issue without overcorrecting.
Should I optimize for ROAS or ROI?
Use ROAS when you need a quick read on ad efficiency, especially within the Google Ads platform. But for real budget decisions, ROI is more reliable. It accounts for everything: fulfillment costs, supporting campaign spend, and actual profit. If you’re managing multiple channels or reporting to a finance team, ROI should be your north star.
What’s the difference between Google Ads conversion value and actual revenue?
Google Ads conversion value is based on the data you pass back to the platform—often modeled, delayed, or tied to early-stage actions like form fills. Actual revenue comes from your CRM, E-Commerce platform, or billing system. It’s what your business actually earned, not what the ad platform assumes. Bridging the two requires clean GCLID tracking and a tool like Attribution to tie spend to outcomes accurately.