When you’re trying to grow an E-Commerce store, there’s a type of tool that will help you the most: analytics tools. E-Commerce analytics tools track and analyze the performance of your store and how users behave on it.
Without them, you’re scrambling in the dark to find the best route to success.
This guide will help you understand why analytics tools are important in your tech stack and provides overviews of the best tools available, separated by categories:
- E-Commerce attribution tools
- Native analytics tools
- User behavior analytics tools
- Data integration and BI analytics tools
- Customer journey and funnel analysis tools
We’ll finish the guide with some best practices on choosing the right tools for your store.
What Are E-Commerce Analytics Tools For?
E-Commerce analytics tools are essential for making data-driven decisions that directly impact your bottom line. These tools help you:
- Track and improve conversion rates by identifying where customers drop off in their buying journey.
- Optimize your marketing spend by showing which channels deliver the best ROI.
- Understand customer behavior patterns to personalize the shopping experience.
- Forecast inventory needs accurately to prevent stockouts and overstock situations.
- Monitor key metrics like Average Order Value (AOV), Customer Lifetime Value (LTV), and cart abandonment rates.
- Make informed pricing decisions based on real-time market data and customer behavior.
For example, Fatty15—a DTC supplement store—decided they needed to improve their data analytics tools and practices. After implementing new solutions, they were able to identify “sleeper” marketing channels with 476.33% to 1,647.68% ROAS.
These insights gave Fatty15’s marketers the opportunity to double their budget for 2025 while maintaining a confident, positive cash flow.
Without these tools, you end up running your store on gut feelings or instinct rather than concrete data. Every decision becomes a gamble rather than a calculated move toward growth.
Best E-Commerce Attribution Tools
E-Commerce attribution tools track and measure how different marketing touchpoints contribute to sales and conversions. These specialized analytics platforms help you understand which marketing channels and campaigns drive revenue for your store.
For E-Commerce store owners, attribution tools are crucial because they:
- Show the ROI of your marketing spend across channels like paid social, email, and organic search.
- Help eliminate wasted ad spend by identifying underperforming campaigns.
- Provide accurate data for scaling successful marketing initiatives.
- Connect customer touchpoints across devices and platforms for a complete view of the buyer journey.
- Help you make data-backed decisions about where to invest your marketing budget.
Without proper attribution, you risk misallocating your marketing budget or giving credit to the wrong channels. For example, many stores overvalue last-click channels while undervaluing awareness channels that initiate customer relationships.
The Attribution Platform
Overview
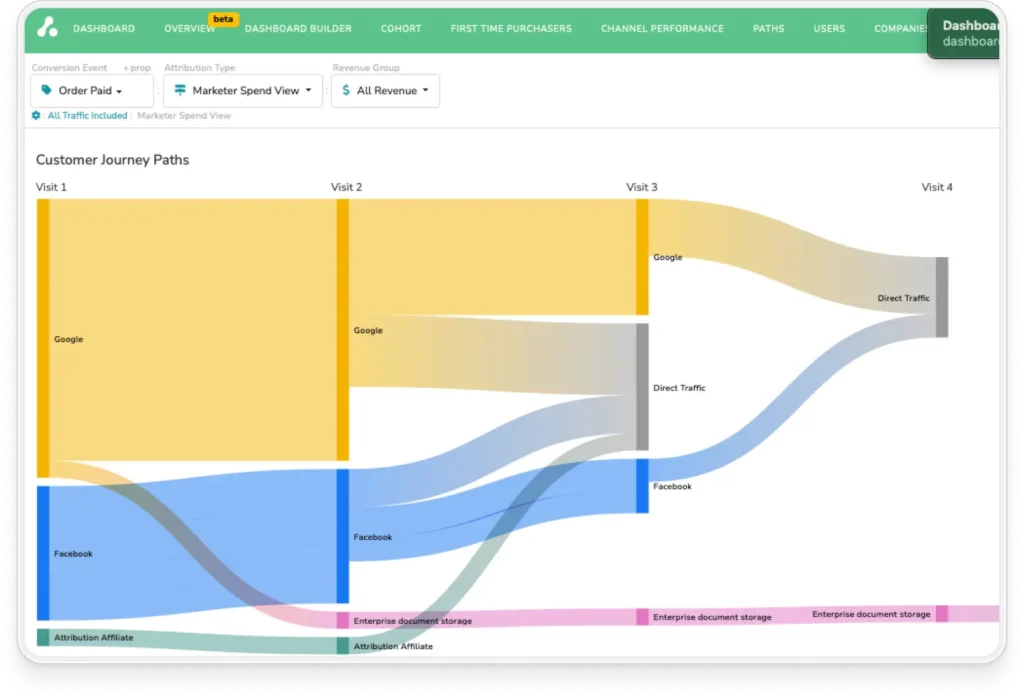
The Attribution Platform is an advanced E-Commerce analytics tool that provides marketers with comprehensive multi-touch attribution and performance insights. It tracks and analyzes the complete customer journey across your channels, attributing precise credit to every interaction.
With The Attribution Platform, you can easily unify marketing data, uncover profitable opportunities, and confidently scale strategies that boost ROI.
Reviews from G2 describe how the platform is intuitive, has easy-to-use visual dashboards, robust reporting capabilities, and seamless integration options.
Key Features
- Multi-touch attribution that accurately credits marketing impact across channels.
- Cross-channel tracking monitors and analyzes customers.
- User and account-level analytics offer granular detail into both individual and account-based customer behavior.
- Revenue attribution that clearly ties marketing activities to revenue outcomes.
- Visual dashboards and reporting give performance insights for quick, strategic decision-making.
- Cohort-based reporting for channel-specific evaluation of Return on Ad Spend (ROAS).
- Seamless integrations with popular marketing tools.
- Journey analytics that visualize detailed user paths.
- Visitor identification and enrichment that tracks and segments anonymous site visitors.
Pros
- Comprehensive attribution capabilities that clearly demonstrate ROI.
- Intuitive and user-friendly visual dashboards.
- Strong integration capabilities with popular marketing and CRM tools.
- Granular reporting features for detailed performance analysis.
Cons
- Initial setup can be complex or time-consuming for some users.
- Certain integrations might require technical support or additional configuration.
Book a Demo
Understand the precise impact of each marketing touchpoint and track “true” CAC, ROAS, and ROI on marketing spend with The Attribution Platform.
Native E-Commerce Analytics Tools
Native E-Commerce analytics tools are the built-in reporting and analysis features that come included with major E-Commerce platforms like Shopify and BigCommerce. These tools provide foundational metrics and insights directly within your store’s backend dashboard.
For E-Commerce store owners, native analytics tools are important because they:
- Provide immediate access to performance metrics like sales, orders, and customer data without additional setup.
- Integrate seamlessly with your store’s operations since they’re built into the platform.
- Offer real-time monitoring of transactions and inventory levels.
- Help establish baseline metrics before investing in more advanced analytics tools.
- Reduce the initial learning curve since they’re designed for your platform.
- Come included with your platform subscription, making them cost-effective starting points.
Successful store owners start by mastering their platform’s native analytics before expanding to specialized tools that fill gaps in their data needs.
Shopify Analytics
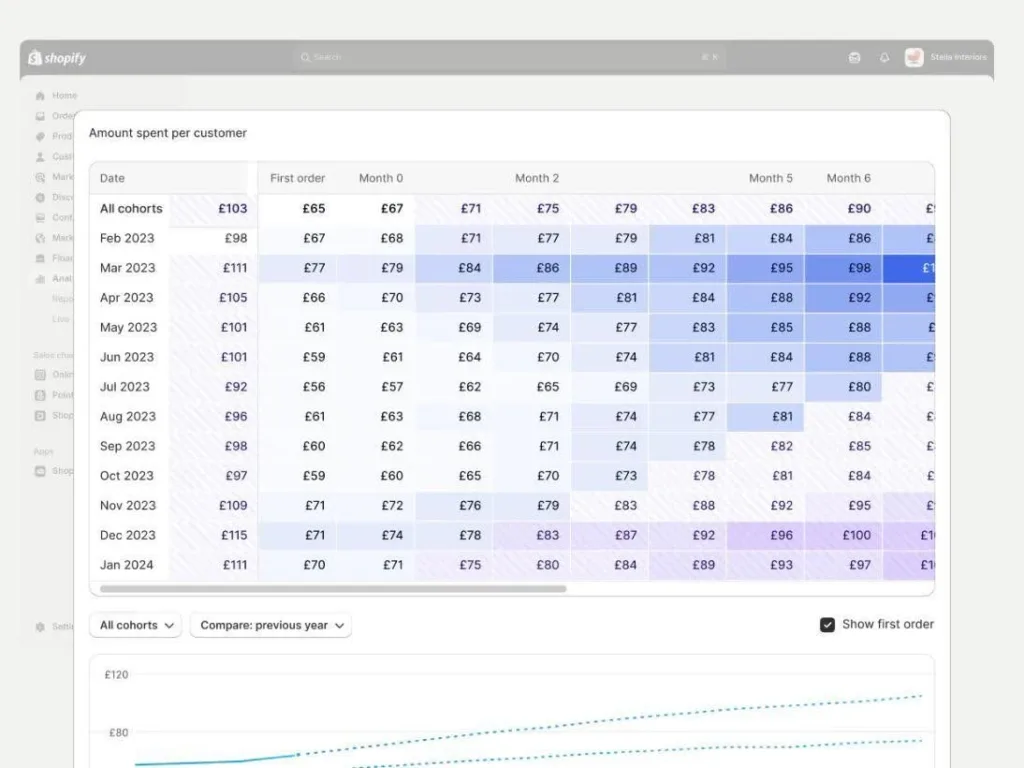
Image source: Shopify
Overview
If you host your E-Commerce store on Shopify, you should be getting to know the native Shopify analytics dashboard. Shopify Analytics offers a unified dashboard and detailed reports—accessible on all plans—that let merchants track sales, orders, sessions, and conversion rates via customizable data cards and visualizations.
You can drill down into specific metrics like customer behavior, inventory, marketing, and financial performance, and create custom reports using ShopifyQL. The Live View feature shows real‑time visitor activity, and dashboard data refreshes within minutes.
Key Features:
- Analytics dashboard that covers the basics, giving you an overview of sales, traffic, and conversion metrics.
- Standard and Custom reports for sales and marketing insights.
- Real-time tracking of active site users and purchases.
- ShopifyQL—a query-based tool for creating custom reports (on higher plans).
- Data visualization charts and cards on the dashboard.
Pros:
- User-friendly interface.
- Real-time insights with Live View.
- Custom report options for deeper analysis.
- Integrated with your Shopify store—no extra setup.
Cons:
- Advanced reports are limited to higher-tier plans.
- Less flexible than third-party analytics tools
- ShopifyQL has a learning curve for non-technical users
Pricing: See full details on Shopify’s pricing page. This pricing is for the full E-Commerce plans that include analytics as standard.
- Basic: from $39/month (or $348/year)
- Grow: from $105/month (or $948/year)
- Advanced: From $399/month (or $3,588/year)
- Plus: from $2,300/month (on a 3-year term)
BigCommerce Analytics
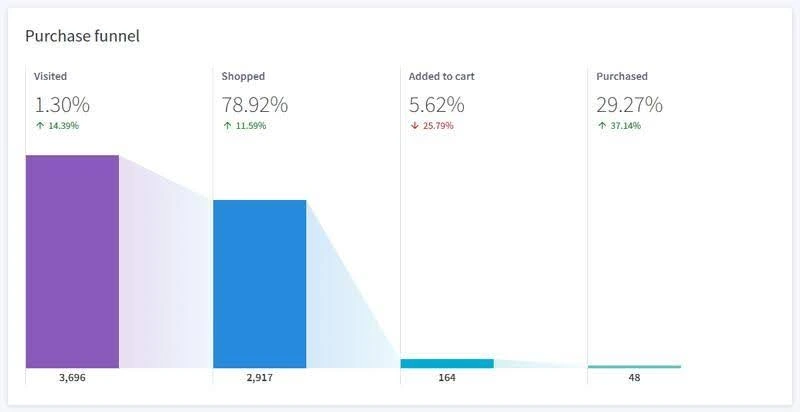
Image source: BigCommerce
Overview
Like the Shopify tool, if you host your store using BigCommerce, you should start getting familiar with its native analytics functionality.
BigCommerce’s built-in E-Commerce Analytics offers 11 ready‑made reports—covering store overview, (near) real-time activity, merchandising, marketing, orders, customers, carts, funnel, search, taxes, and more.
Dashboards include charts with hover-over insights and data range selectors, refreshing almost in real time. You can also export key reports (e.g., sales, cart recovery) as CSVs. Plus, an optional E-Commerce Insights add-on offers deeper customer, product, and channel analysis for optimizing conversions and lifetime value.
Key Features:
- Built-in reports that cover sales, customers, orders, products, funnels, and more.
- Real-time dashboard that updates with near-instant (60 seconds) data refresh.
- E-Commerce insights add-on for advanced analysis of customer behavior and product performance.
- CSV exporting for deeper offline analysis.
- Interactive visualizations that give you “hover-over” data, date filtering, and segmentation.
Pros:
- Comprehensive reporting out of the box.
- Fast, near real-time updates.
- Advanced insights available for growth-focused teams.
- No extra setup needed for built-in reports.
Cons:
- E-Commerce Insights requires a paid add-on.
- Less customizable than third-party tools.
- Some metrics may lack granularity for power users.
Pricing: See full details on BigCommerce’s pricing page. Besides the enterprise plan, the other plans are the same price as Shopify (and are full E-Commerce packages with analytics included):
- Standard: from $39/month (or $348/year)
- Plus: from $105/month (or $948/year)
- Pro: From $399/month (or $3,588/year)
- Enterprise: Custom quote
User Behavior Analytics Tools
User behavior analytics tools offer detailed insights into how visitors interact with your E-Commerce store by tracking clicks, scrolls, mouse movements, and other on-site actions. These tools create visual representations of user behavior through heatmaps, session recordings, and interaction analysis.
User behavior analytics tools are useful for E-Commerce store owners because they:
- Reveal exactly where customers get stuck or abandon their shopping journey.
- Help optimize product page layouts and checkout flows based on actual user interaction data.
- Identify usability issues that analytics numbers alone can’t show.
- Provide visual evidence to support UX and design decisions.
- Allow you to see how different customer segments interact with your store.
- Help diagnose and fix conversion bottlenecks by showing where users drop off.
Without user behavior analytics, you might have data showing that customers are leaving your site, but you won’t know why. These tools bridge the gap between what your customers do and why they do it, helping you make informed design and usability improvements that directly impact sales.
Hotjar
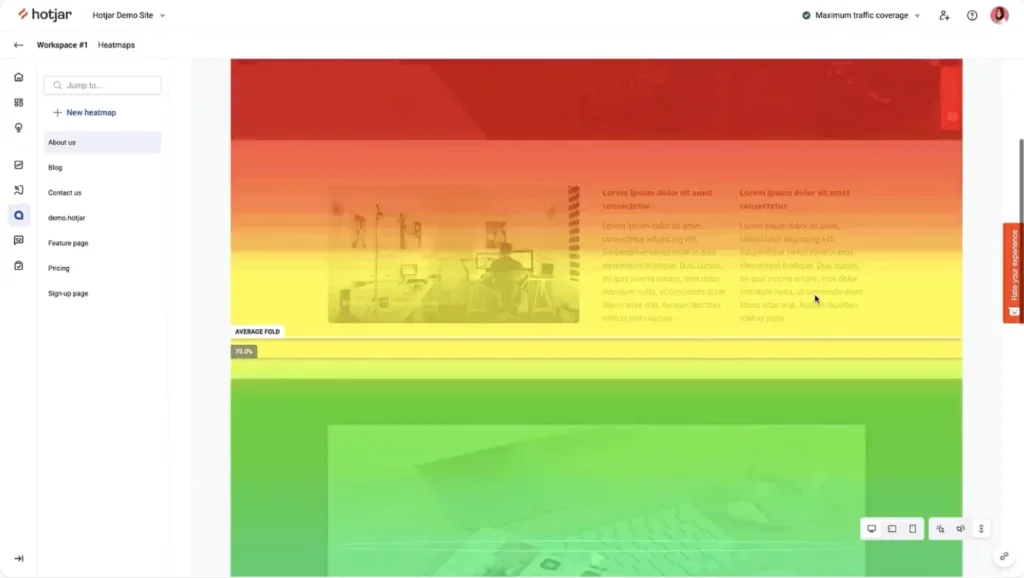
Image source: Hotjar
Overview
Hotjar offers E-Commerce stores powerful behavioral analytics and feedback tools, like heatmaps, session recordings, surveys, and polls that reveal how shoppers interact, scroll, click, and where they hesitate.
You can watch real user journeys to identify shopping cart friction, optimize product pages, and validate design changes with direct feedback. While it doesn’t offer hard metric overviews, it does offer a complement to traditional analytics tools by showing the “why” behind visitor actions.
Key Features:
- Heatmaps that help you visualize where users click, scroll, and move on your site.
- Session Recordings to watch real user journeys to identify friction points.
- Surveys and Feedback Widgets that collect customer insights directly on-site.
- Funnels and conversion tracking to spot where users drop off.
- User interviews (Ask) gives you the option to schedule interviews with visitors for deeper insights (separate paid feature).
Pros:
- Easy to set up and use.
- Visual, intuitive insights—especially for non-technical teams.
- Great for identifying UX issues and boosting conversions.
- Complements analytics tools like GA or Shopify reports.
Cons:
- Limited quantitative data—best used with other tools.
- Session recordings may miss some sessions on higher-traffic stores unless on a paid plan.
- Data sampling can delay or reduce accuracy for large stores.
Pricing: See full details on Hotjar’s pricing page. These packages are for Hotjar’s “Observe” plans that include heatmapping and session recordings—you can also conduct user research on separate plans.
- Free plan available (for up to 35 daily sessions)
- Plus: from $39/month
- Business: from $99/month
- Scale: from $213/month
Crazy Egg
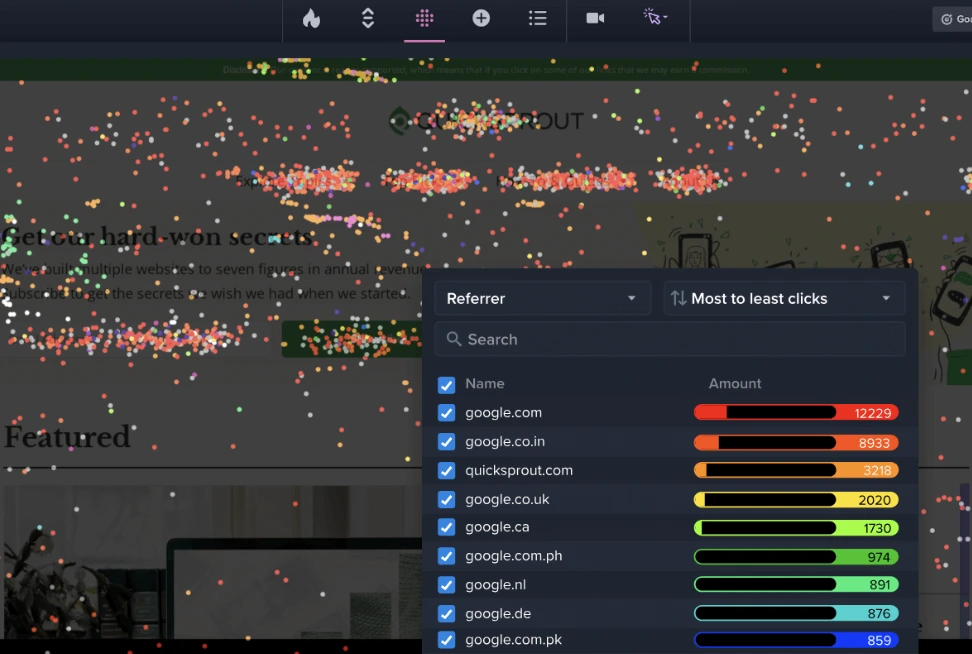
Image source: Crazy Egg
Overview:
Like Hotjar, Crazy Egg offers E-Commerce store owners visual optimization tools like heatmaps, scrollmaps, confetti click overlays, and session recordings. These tools help users uncover how shoppers interact with product pages and funnel.
The platform also offers A/B testing, which lets you tweak page elements like CTAs, copy, and element layouts without coding, and automatically channels traffic to top-performing variants.
Key Features:
- Heatmaps and Scrollmaps help visualize clicks and movement across your store.
- Session recordings replay real user interactions to spot friction.
- Confetti reports that show you where clicks come from by referral source, search terms, etc.
- A/B testing tool that helps test variations without the need for developer support.
- Quick page editor to make changes to layout or content for tests.
- Traffic analysis and snapshots to track user behavior on specific URLs over time.
Pros:
- Easy setup—no coding required for most features.
- Visual and intuitive for E-Commerce teams.
- All-in-one CRO tool with testing and analytics.
- Great for identifying design flaws or drop-off areas.
Cons:
- Session recording depth can be limited on lower-tier plans.
- Not as advanced for deep funnel or cohort analysis.
- You’ll likely need additional tools for broader analytics (e.g., GA, Shopify reports).
Pricing: See full details on Crazy Egg’s pricing page. It’s worth noting all plans are billed annually—there’s no monthly payment option.
- Free trial available (30 days)
- Starter: $29/month
- Standard: $49/month
- Plus: $99/month
- Pro: $249/month
Data Integration and BI Analytics Tools
Data integration and Business Intelligence (BI) analytics tools connect multiple data sources into unified dashboards and reports, allowing you to analyze data from across your entire E-Commerce tech stack. These tools help transform raw data into actionable insights through visual reports, automated analysis, and customizable dashboards.
For E-Commerce store owners, data integration and BI tools are valuable because they:
- Consolidate data from multiple sources (like your store platform, marketing tools, and inventory systems) into a single source of truth.
- Enable custom reporting that matches your specific business KPIs and metrics.
- Automate data collection and analysis to save time on manual reporting.
- Provide advanced visualization capabilities to spot trends and patterns more easily.
- Allow for deeper data analysis through features like drill-downs and statistical modeling.
- Help identify correlations between different business areas that affect sales performance.
Without proper data integration and BI tools, you’re left piecing together insights from separate platforms manually, which is time-consuming and prone to errors. These tools help you make faster, more accurate decisions by giving you a complete view of your business performance in one place.
Google Looker Studio
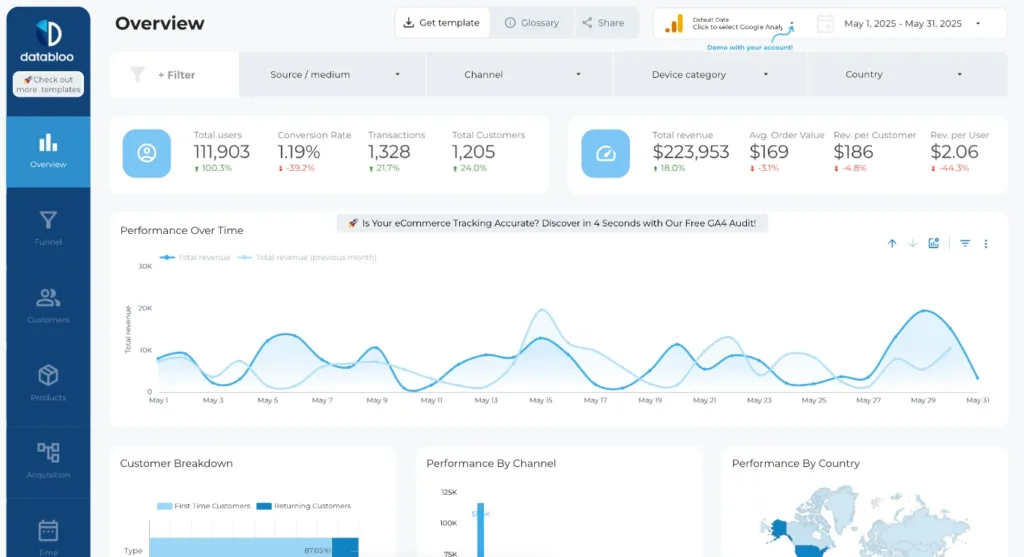
Image source: Looker Studio Demo
Overview
Google Looker Studio (formerly Data Studio) is a free, highly customizable dashboard and reporting tool that connects to data sources like GA4, Shopify, Google Ads, and more.
E-Commerce store owners can use it to build tailored dashboards for sales, funnels, products, marketing performance, and inventory insights. You can use templates or start from scratch with interactive charts, filters, and shareable reports.
Key Features:
- Custom dashboards help you build tailored reports for your store.
- Data source integrations help you unify data (Google products are free, third-party data connectors may incur fees).
- Interactive visuals with charts, filters, and tables for dynamic exploration.
- Pre-built E-Commerce reporting templates.
Pros:
- Free to use.
- Highly customizable.
- Ideal for centralizing multi-channel E-Commerce data (if using Google products).
- Supports real-time or scheduled updates.
- Shareable, collaborative reports.
Cons:
- A steeper learning curve for beginners.
- Some E-Commerce connectors (e.g., Shopify) require third-party tools.
- Advanced features can be time-consuming to set up.
- Performance may lag with large datasets or complex blends.
Pricing: See full details on Google’s pricing page.
- Free: The core functionality of Looker Studio is free to use.
- Looker Studio Pro: $9 per user, per project, per month
Microsoft Power BI
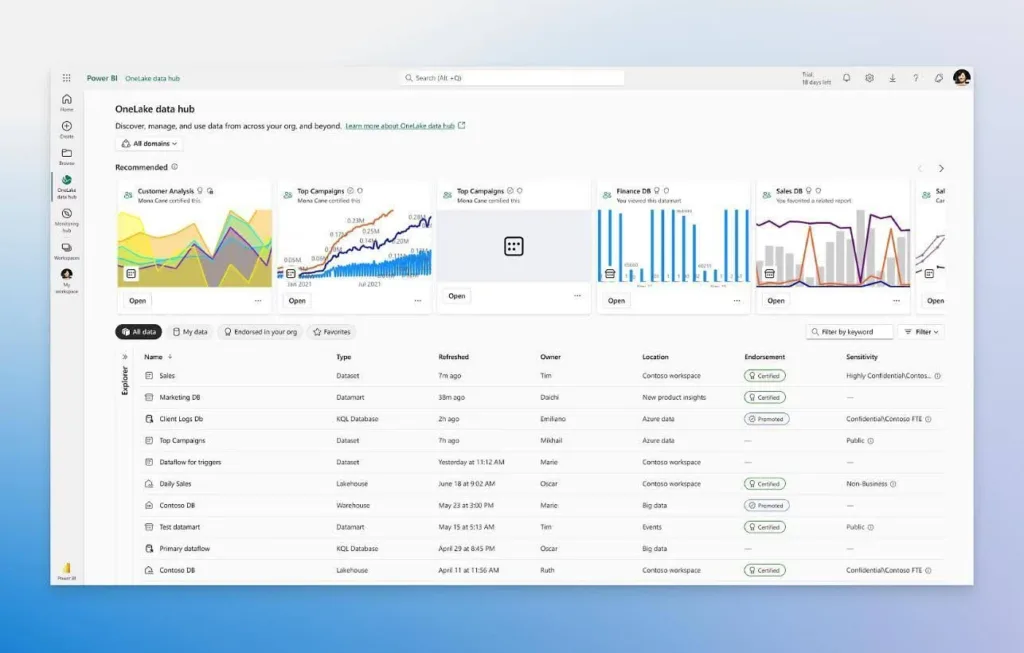
Image source: Microsoft
Overview:
Microsoft Power BI is a powerful business intelligence tool that can help E-Commerce store owners visualize and analyze data from across platforms—like Shopify, Google Analytics, Excel, and CRM systems.
With customizable dashboards, real-time tracking, and AI-driven insights, store owners can monitor sales trends, product performance, and customer behavior in one place.
Given that it’s a Microsoft product, it offers seamless integration with Microsoft tools (e.g. Excel, Teams, Azure), making it ideal for scaling insights across teams and channels that already use these tools.
Key Features:
- Data integration with popular tools like Shopify, WooCommerce, CRMs, GA4, and more.
- Customizable dashboard and reports using drag-and-drop functionality.
- AI and predictive tools, which let you use natural language queries.
- Collaboration and mobile access give you shareable dashboard views on desktop, mobile, and Teams.
Pros:
- Unifies omnichannel data in one place.
- Robust real-time and interactive visuals.
- Scalable for any business size with powerful BI capabilities.
- Deep Microsoft ecosystem integration (Excel, Azure, Teams).
- Advanced AI features for deeper insights.
Cons:
- Steep learning curve for setup and modelling.
- Can struggle with large E-Commerce datasets unless optimized.
- Some connectors (e.g., Shopify) require intermediate steps or third-party tools.
Pricing: See full details on Microsoft’s pricing page. Note that prices are billed annually—there’s no monthly payment option.
- Free plan available.
- Power BI Pro: $14/user/month
- Power BI Premium: $24/user/month
- Power BI Embedded: Variable (contact sales)
Customer Journey and Funnel Analysis Tools
Customer journey and funnel analysis tools help you visualize and optimize how visitors move through your store’s conversion path, from first visit to purchase and beyond. These specialized platforms map out the entire customer lifecycle, identifying key touchpoints and conversion opportunities while measuring drop-off rates at each stage.
Customer journey and funnel analysis tools are essential for E-Commerce store owners because they:
- Map out the complete customer journey across multiple touchpoints and channels.
- Identify specific stages where customers drop off in your conversion funnel.
- Track customer segments to understand how different audiences move through your funnel.
- Measure the effectiveness of each step in your sales process.
- Help optimize your conversion funnel based on real customer behavior data.
- Enable personalized customer experiences based on journey stage and behavior.
- Provide insights for reducing cart abandonment and improving checkout completion.
Without proper journey and funnel analysis tools, you risk missing critical conversion opportunities and failing to understand why potential customers aren’t completing purchases. These tools help you create more efficient paths to purchase by revealing where and why customers get stuck in their buying journey.
Mixpanel
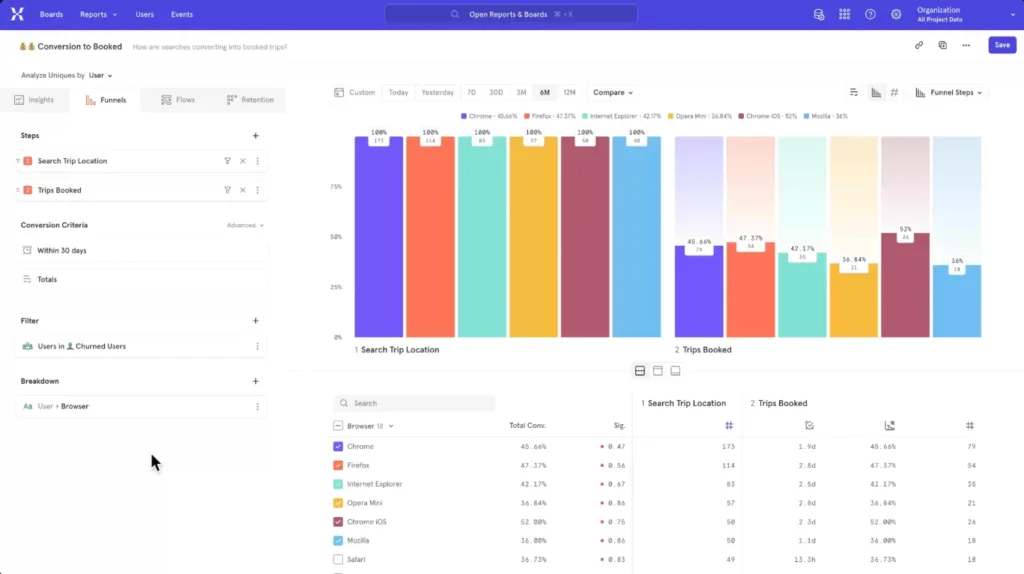
Image source: Mixpanel
Overview:
Mixpanel is an event-driven analytics platform which can help E-Commerce brands understand shopper behavior—from product views to purchases—with precision. It offers cart and funnel analyses, cohort tracking, session replay, and real-time dashboards to identify cart abandonment and retention trends.
With built-in E-Commerce templates and deep segmentation tools, Mixpanel helps you make data-led UX and marketing improvements. Integration via SDK/snippet is straightforward, though tracking requires intentional event setup.
Key Features:
- Event-driven analytics and funnels to track granular shopper actions.
- Cart analysis and E-Commerce template reports that automatically track cart behavior and revenue per product.
- Cohort and retention analysis options to monitor repeat purchases and lifecycle trends.
- Session replays that help uncover UX issues.
- Real-time, interactive dashboards and custom reporting.
Pros:
- Clean, user-friendly user interface.
- Real-time insights and flexible event tracking.
- Powerful segmentation and funnel analysis.
- Responsive customer support (according to reviews).
Cons:
- Steep learning curve for manual report building.
- Higher cost, especially for full feature access or scaling up.
- Some reviewers note data export and integration challenges.
- Occasional data gaps and inaccuracies.
Pricing: See full details on Mixpanel’s pricing page.
- Free plan available: Up to 1M monthly events.
- Growth: $.00028 per event after 1M (with volume discounts available).
- Enterprise: Contact sales.
Heap
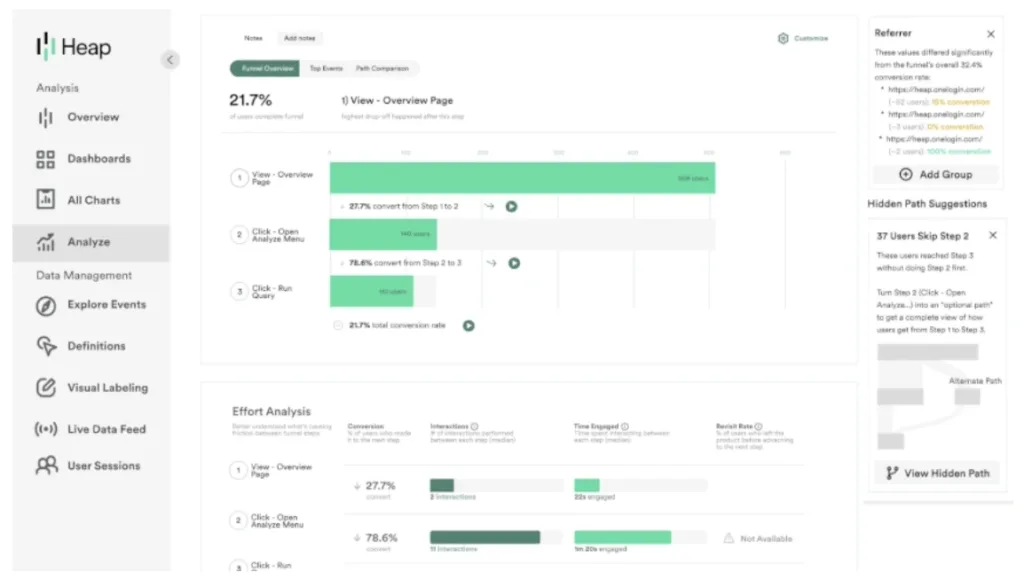
Image source: Heap
Overview:
Heap offers a no-code, event-driven analytics platform that E-Commerce store owners can use to optimize store UX. It uses autocapture to automatically record every click, view, and form interaction—then lets you retroactively define events without developer help.
With session replay, funnel and path analysis, and AI-driven insight alerts, Heap can help teams uncover friction points, optimize UX, and drive conversions effectively.
Key Features:
- Autocapture and manual event tags that record user interactions, with retroactive event definition.
- Session replay lets you see user sessions and spot UX issues.
- Funnels, paths, and retention analysis tools help build behavioral flows and cohort reports.
- Effort analysis and AI insights detect friction and surface “unknown” patterns via Heap Illuminate.
- Shareable, visual dashboards with live alerts via Slack or email.
Pros:
- Requires minimal engineering.
- Powerful retroactive tracking.
- Fast query performance and intuitive UI.
- Excellent support and AI guidance, according to reviews.
Cons:
- Feature overload and learning curve can be overwhelming at first.
- Performance issues with large datasets.
- Pricing is prohibitive unless you need advanced features.
- Navigation can be difficult with large event pools.
Pricing: See full details on Heap’s pricing page.
- Free plan available
- There are three paid plans available, but you only get pricing estimates after installing Heap’s free snippet to analyze data volume.
How To Choose The Right E-Commerce Analytics Tools
Choosing the right analytics tools for your E-Commerce store requires a strategic approach. The key is establishing clear evaluation criteria that align with your business needs and growth trajectory.
Start by auditing your current data gaps and business objectives. Are you struggling with attribution across multiple marketing channels? Do you need better customer journey insights? Is inventory forecasting a priority?
Your specific pain points should drive your tool selection process, not marketing trends or competitor choices.
Prioritize tools based on these core criteria:
- Integration capabilities with your existing tech stack (E-Commerce platform, CRM, email tools, ad platforms).
- Data accuracy and attribution modeling that matches your customer journey complexity.
- Scalability to grow with your business without requiring complete overhauls.
- Actionable insights rather than just data visualization—can you make decisions from the reports?
- Implementation complexity versus your team’s technical resources and timeline.
You should think about avoiding tool redundancy by choosing multifunctional solutions. It’s easy to fall into the trap of using separate tools for attribution, customer analytics, inventory forecasting, and marketing performance—but it creates data silos and inflated software costs.
Instead, prioritize platforms that consolidate multiple analytics functions into unified dashboards.
Rather than using separate tools for email attribution, paid ad tracking, and customer lifetime value analysis, The Attribution Platform can provide all three capabilities with consistent data and methodology.
Unlike single-purpose tools that create data fragmentation, The Attribution Platform provides unified insights across your entire marketing ecosystem. You get accurate multi-channel attribution, customer journey analysis, real-time ROI tracking, and detailed performance metrics for every channel—all in one platform.
Ready to see how The Attribution Platform can simplify your analytics while improving accuracy? Book a demo with our team to find out how unified E-Commerce analytics can transform your marketing performance.
E-Commerce Analytics Tools FAQs
Do I need both quantitative and qualitative analytics tools?
Yes, you need both since quantitative tools tell you what’s happening (like conversion rates and sales numbers), while qualitative tools help you understand why it’s happening through user feedback and behavior patterns.
How do I measure ROI across multiple marketing channels?
Use an attribution tool that can track cross-channel performance and assign proper credit to each touchpoint in the customer journey.
How often should I review my E-Commerce analytics?
Review your key metrics daily for immediate issues, but conduct deeper analysis weekly or monthly to identify trends and make strategic decisions.
Can E-Commerce analytics tools help with inventory management?
Analytics tools can predict demand patterns, alert you to low stock levels, and help optimize inventory levels based on historical sales data and seasonal trends.
How do I ensure my analytics data is accurate?
Regularly audit your tracking setup, use proper UTM parameters for all campaigns, and implement server-side tracking where possible to avoid data loss from ad blockers.