Manually tracking multiple marketing channels can be burdensome.
If you create spreadsheets manually, they’re prone to human error. But without a spreadsheet, you’ll need to rely on each marketing channel’s analytics features.
In these cases, consider building a custom attribution dashboard instead.
This guide shows how to build and customize an attribution dashboard to display the buyer journey, compare models, and optimize marketing spend.
What Is An Attribution Dashboard And Why Does It Matter?
An attribution dashboard is a tool marketers use to track and measure the performance of multi-channel marketing efforts.
Customized attribution dashboards unify campaign, channel, and conversion data for a complete view of the customer journey.
A structured marketing attribution dashboard also reduces data discrepancies, aligns goals with business objectives, and improves decision-making.
By building a customized attribution dashboard, Vendr saved 2–3 days per month and increased Return on Ad Spend (ROAS) by 8.6x.
Book a Demo
Understand the precise impact of each marketing touchpoint and track “true” CAC, ROAS, and ROI on marketing spend with The Attribution Platform.
Essential Components Of An Effective Attribution Dashboard
Before building an attribution dashboard you need to know what makes them effective. Without this, you risk failure or wasting resources.
An effective attribution dashboard includes these components:
- Data integration capabilities
- Multi-touch attribution models
- Customizable visualizations
These components help build a complete picture of marketing performance.
For example, integrating Salesforce offline sales data with multi-touch attribution models measures sales calls’ impact alongside online interactions like ebook downloads or webinar attendance. A custom visualization then interprets the full journey.
The Attribution Platform provides a dashboard with an intuitive interface incorporating these essential elements:
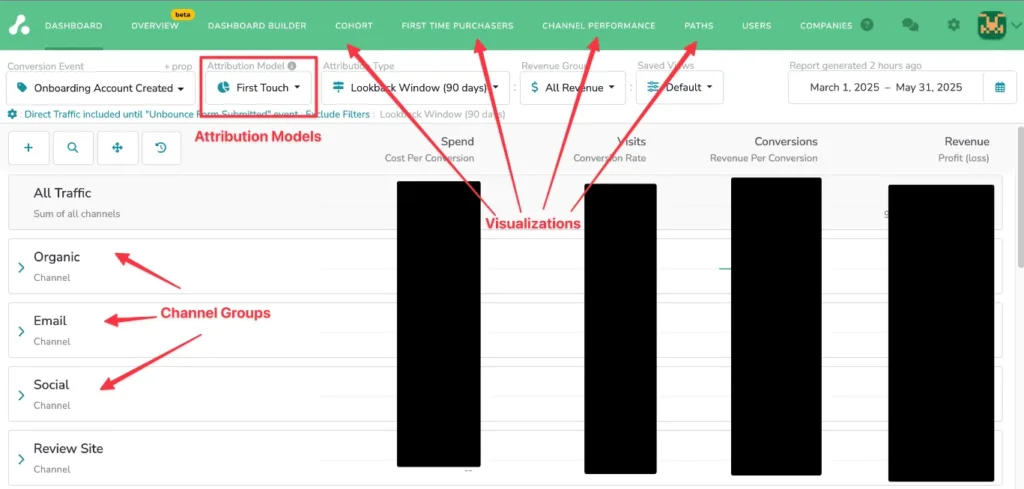
Let’s examine these components in more detail.
Data Integration Capabilities: Effective dashboards automatically pull data from multiple sources and offer real-time synchronization for accurate reporting.
Choose a dashboard builder that integrates with all your major platforms.
Multi-Touch Attribution Models: Google Analytics 4 doesn’t have many choices for attribution modeling. Your dashboard should support various models for comparisons and flexibility.
Flexible attribution modeling lets you tailor data to business needs and functions. For instance, last-touch attribution isn’t suitable for B2B businesses with long sales cycles.
Customizable Visualizations: Data tables show lots of information, but visualizations often make interpretation easier.
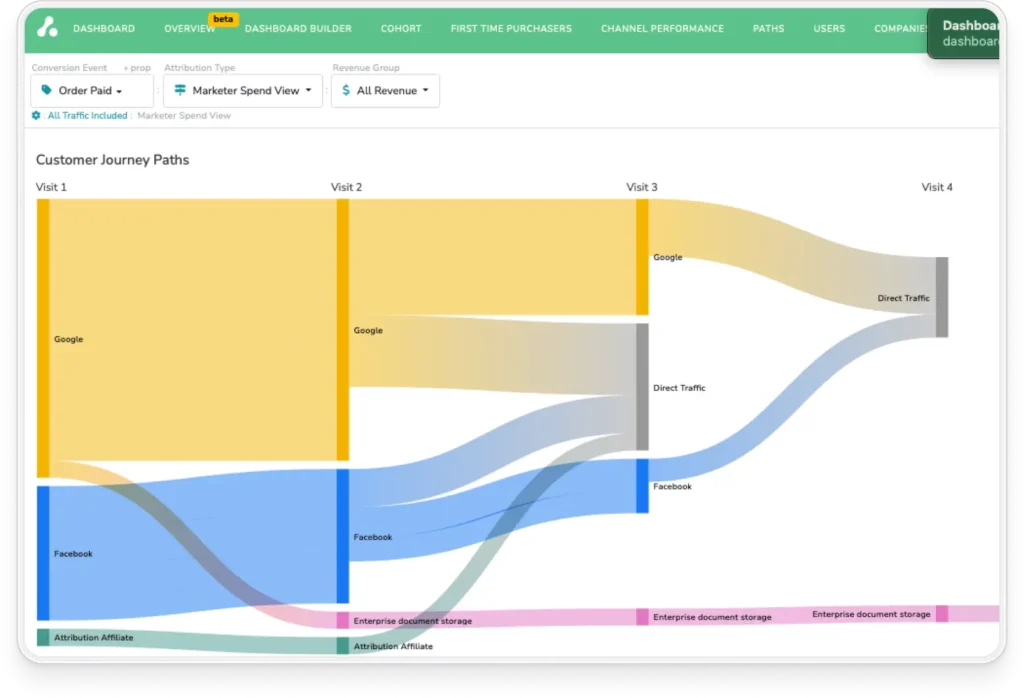
- A customer path analysis shows high-performers or drop-off points in customer journeys.
- A first-time purchaser diagram can reveal acquisition strategy effectiveness.
- A cohort analysis can show you the ROI of a specific group of customers over time.
Each visualization helps tell the marketing story, tailoring views for different stakeholders.
Build Your Attribution Dashboard in 7 Steps
We’ll use The Attribution Platform for examples, with screenshots showing its interface and features. But you could, in theory, follow the same steps with whichever attribution software you choose.
Step 1: Combine CRM, CDP, and Ad Platform Data
Before considering your dashboard’s design, make sure your data streams are set. First, integrate relevant marketing channels like Google Analytics, Google Ads, Facebook Ads, CRM, E-Commerce, and offline events.
Think in categories—Paid, Owned, Offline, etc.
Combining all data sources in your attribution dashboard reduces blind spots and tracks all interactions.
Integrate Ad Platforms
Your provider should integrate with major ad platforms like Google Ads, Facebook, and LinkedIn ads. If you use Google Looker Studio, you’ll need third-party data connectors, which may cost extra.
The Attribution Platform simplifies the process with pre-built integrations.
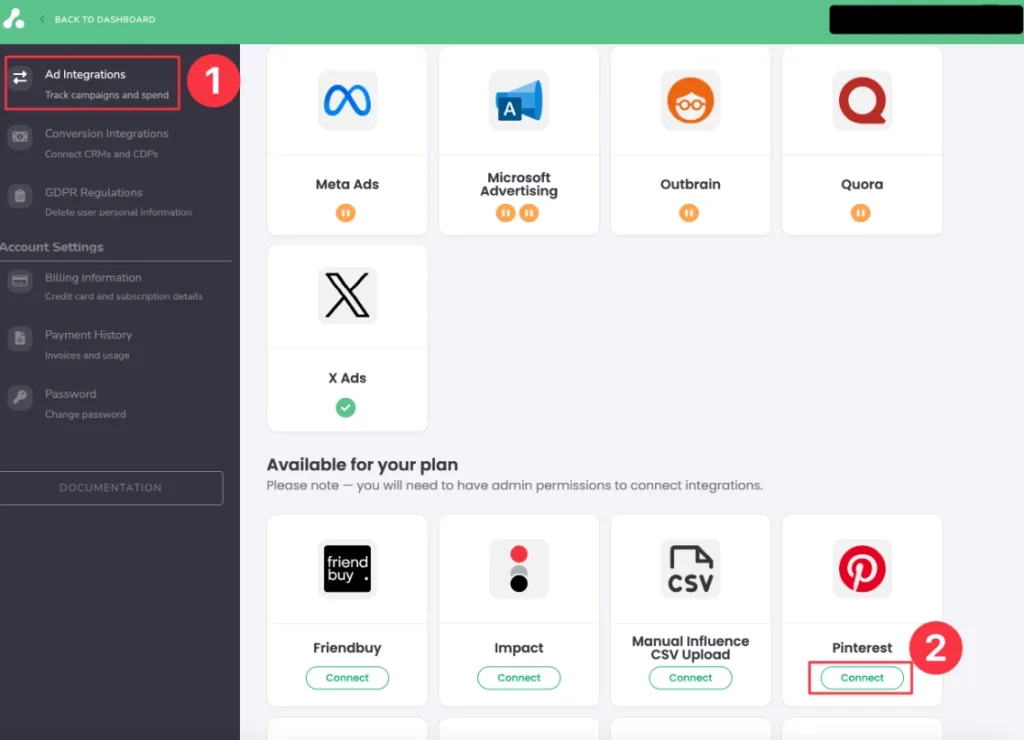
Click “Ad Integrations” in the settings menu, then “Connect” to start platform integrations. Follow on-screen instructions to authenticate; it’s just a few clicks.
Connect CRM and offline events.
Connect your CRM and offline events data streams after ad platforms. In The Attribution Platform, go to “Conversion Integrations” and select the platform you want to connect.
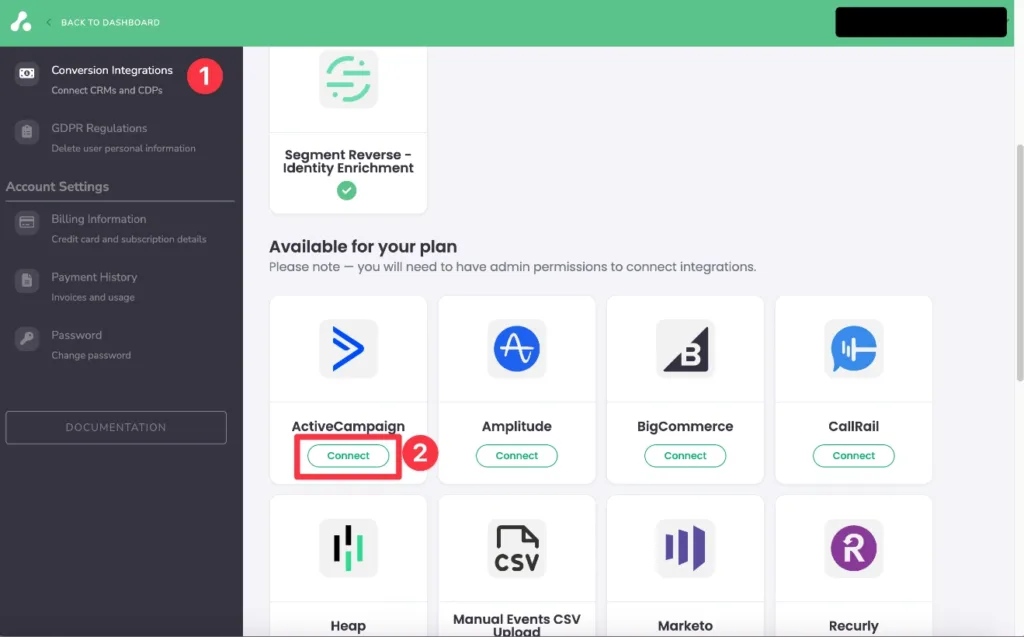
Platforms like CallRail or Salesforce can record offline data like sales calls—if available, use them. If not, use CSV files to manually record offline events.
Incorporate Non-Traditional Sources
Your business might use software lacking native integrations or APIs, like Amazon or Shopify (though The Attribution App integrates with Shopify for E-Commerce attribution data).
There are three main ways to approach this data stream:
- Manual data upload via CSV files for custom data.
- Using Webhooks or scripts, the platform offers an event-tracking API for sending custom events on unsupported platforms.
- Use middleware platforms like Zapier, Make.com, or custom ETL solutions to bridge non-traditional data sources and your attribution dashboard.
The Attribution Platform lets you create custom sources to tag and track non-native data, keeping your data clean and segmented.
Step 2: Define Key Metrics For ROI Tracking
After integrating your data sources, define the most important metrics for your goals. Common metrics include:
- Customer Acquisition Cost (CAC)
- Return on Ad Spend (ROAS)
- Customer Lifetime Value (LTV)
The most important metrics depend on your business type—B2B vs. B2C, or E-Commerce vs. SaaS might mean different metrics align with business goals.
Here are some industry-specific examples:
- E-Commerce: Average Order Value (AOV), Purchase Frequency, Cart Abandonment Rate, etc.
- SaaS: Cost Per Free Trial/Demo, Trial-to-Paid Conversion Rate, CLV, Churn Rate, etc.
- B2B: Leads by Source, Cost Per MQL, Lead-to-Close Time, Account-Based Attribution (multi-contact within one company), etc.
- B2C: Engage-driven Conversions, CAC, LTV by Acquisition Channel, Bookings/Sign-Ups by Channel.
Let’s examine these metrics in detail.
Revenue Metrics
Your attribution dashboard should track revenue metrics like ROI, ROAS, Total Revenue, and Revenue by Channel, useful for any business model.
In The Attribution Platform, we have a Beta “Overview” view for quick access to these metrics in one dashboard (data redacted for privacy):
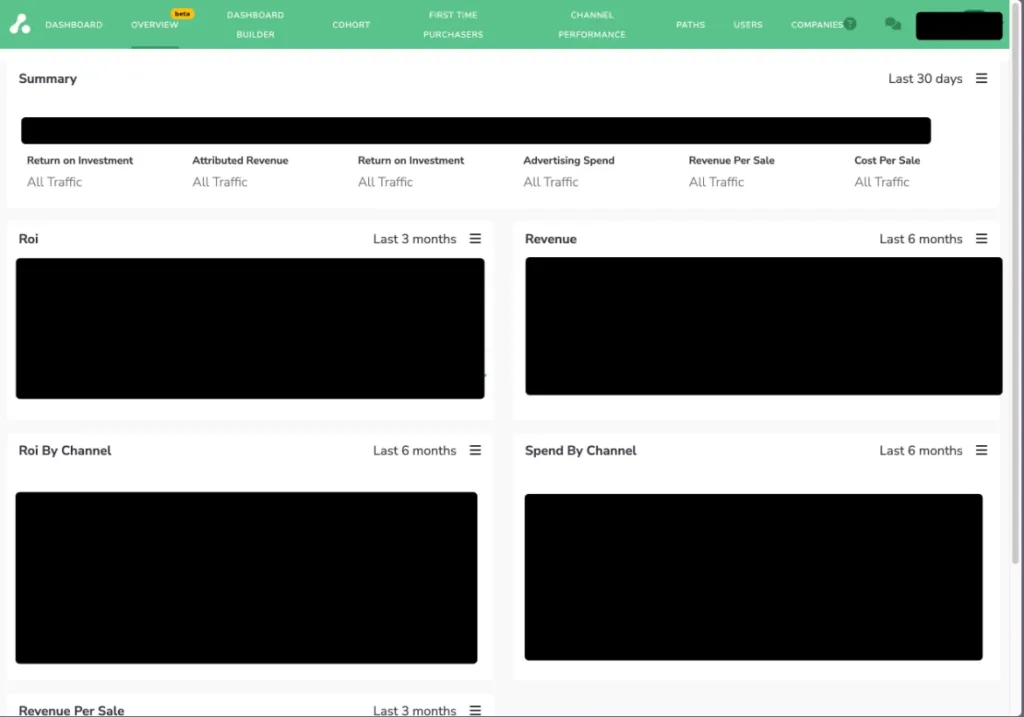
To set up this dashboard, pull revenue data from conversion sources and spend data from ad platforms. The platform will run the formulas, such as:
ROAS = Revenue / Ad Spend
ROI = (Revenue – Cost) / Cost
Use standardized naming conventions for tracking data to group parameters for detailed results.
Cost Metrics
Accurate cost data lets you monitor cost-based metrics like:
- CAC
- CPL (Cost per Lead)
- Cost Per Conversion
- Churn Rate
Make sure you capture cost data across all channels to avoid skewed metrics. Here’s how to capture all your cost data:
- Use native integrations wherever possible for simplicity.
- Set up CSV uploads for unsupported platforms.
- Use middleware tools to automatically pull data without integrations.
- Log manual marketing expenses for cost data not in platforms (freelancer fees, production costs, influencer payments, etc.).
- Check for gaps/inconsistencies regularly.
- Standardize naming conventions to join cost and conversion data for reporting.
These tips should get you most (if not all) of the way there.
Engagement Metrics
Some metrics aren’t tied to costs or revenue. These engagement-based metrics track customer interactions, such as:
- Time on Site/Page: Shows user interest by how long they stay.
- Pages per Session: Shows how deeply users explore your site.
- Bounce/Exit Rates: Show where users lose interest.
- Scroll Depth/Video Watch Time: Shows content consumption levels.
- Email Open and Click Rates: Measures how effectively emails engage users.
- tracks key actions like clicks, downloads, or form starts.
- Session Frequency and Recency: Show how often and recently users return before converting.
These metrics reveal why a conversion happened and show which channels add value beyond last-click attribution.
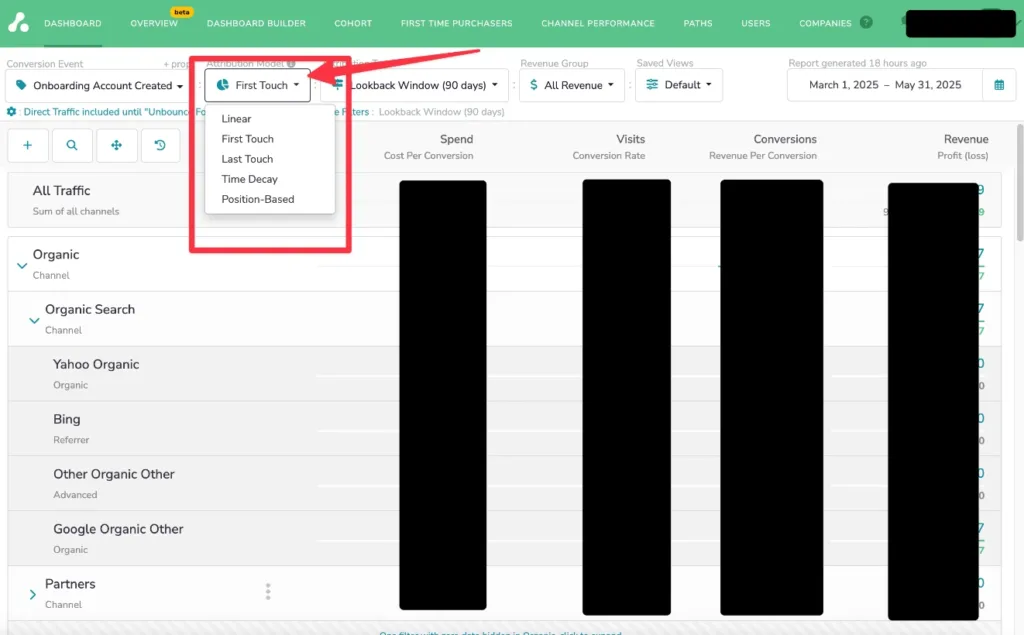
Step 3: Compare Multi-Touch Attribution Models
After defining ROI metrics, choose attribution models for your business.
- First-touch: This model gives all credit to the first interaction with your business.
- Last-touch : Credits the last interaction before conversion.
- Time Decay: This model credits all touchpoints, giving more weight to those closer to conversion.
- Linear attribution: This model distributes credit equally across all touchpoints.
- Position-based: This model uses shapes like U-shaped or W-shaped, emphasizing credit at start and end points or key mid-funnel touchpoints.
- Custom attribution: Allows creating a model that aligns with your business reality once you have enough data.
These models have pros and cons and suit certain business types more. In The Attribution Platform, you can toggle between these models.
First-Touch Vs. Last-Touch
First and last-touch models are the simplest, but both have the same pros and cons.
- First-touch reveals which touchpoint builds brand awareness, while last-touch shows which one nudges customers to convert.
- Both models are often too simplistic for detailed analysis.
- Both give insight into one end of the customer journey.
These models suit businesses with short sales cycles, like E-Commerce stores with low-value products.
Time Decay Vs. Position-Based
Both models distribute credit across the journey. Weighting mid-funnel interactions reveals influential touchpoints, not just first or last-click. A blog post or webinar may not convert directly, but they drive users who later purchase.
These deeper insights help optimize spending. The Attribution Platform applies these models to credit each touchpoint, giving a more accurate view of ROI drivers.
Custom Attribution Models
Custom weighting is useful for unique sales cycles. In B2B, early touchpoints like white papers and demos are often more influential than the last click.
To develop custom attribution rules, map your typical journey, identify key actions, and assign weight based on impact.
The Attribution Platform supports creating and comparing custom models to see which fits your customer behavior best.
Step 4: Customize Attribution Rules
Custom attribution rules enhance your dashboard by allowing you to tailor models to your business, like excluding direct traffic or adjusting for branded search.
This approach is crucial for complex sales cycles or product-led growth. Flexible attribution ensures your model reflects buyer behavior.
The Attribution Platform lets you build and test custom rules with its intuitive interface—no technical skills needed. Here’s a quick look:
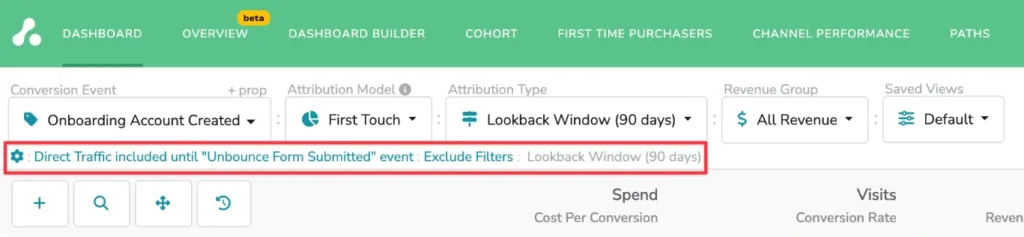
Custom rules align measurement with real behavior; let’s examine some rule types.
Channel Grouping And Classification
Organize channels by traffic type or marketing function, like Paid Search, Organic, Social, Email, and Direct, to keep data clean for consistent reporting. Group related efforts to spot trends, allocate budget, and compare performance.
Proper classification prevents overlap and ensures attribution models assign credit correctly. The Attribution Platform lets you customize channel groupings and rules, clearly labeling sources to match your marketing structure.
This clarity improves decision-making by analyzing performance by channel impact, not fragmented or misattributed data.
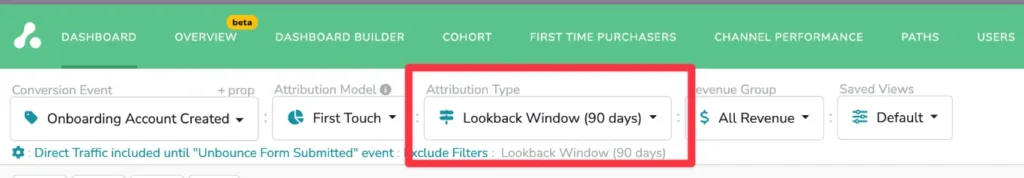
Conversion Window Settings
Lookback windows define how far back touchpoints are considered in a conversion path. For fast-moving B2C or E-Commerce, a 7–14 day window may be fine. On the other hand, B2B or high-consideration purchases often require 30–90 day windows due to longer sales cycles.
Choosing the right window ensures meaningful touchpoints are credited; too short misses key interactions, too long adds noise.
The Attribution Platform lets you set flexible windows per model to align attribution with your buying journey and test how different windows affect insights.
Attribution Exclusions
Exclude touchpoints like internal traffic, spam referrals, or redirects when they don’t influence the customer journey.
Direct traffic is excluded when it’s a fallback funnel, not a meaningful interaction. In B2B, customer support logins or existing client activity might be irrelevant for new conversions.
Your dashboard should allow custom exclusion rules to keep reporting focused on real marketing impact.
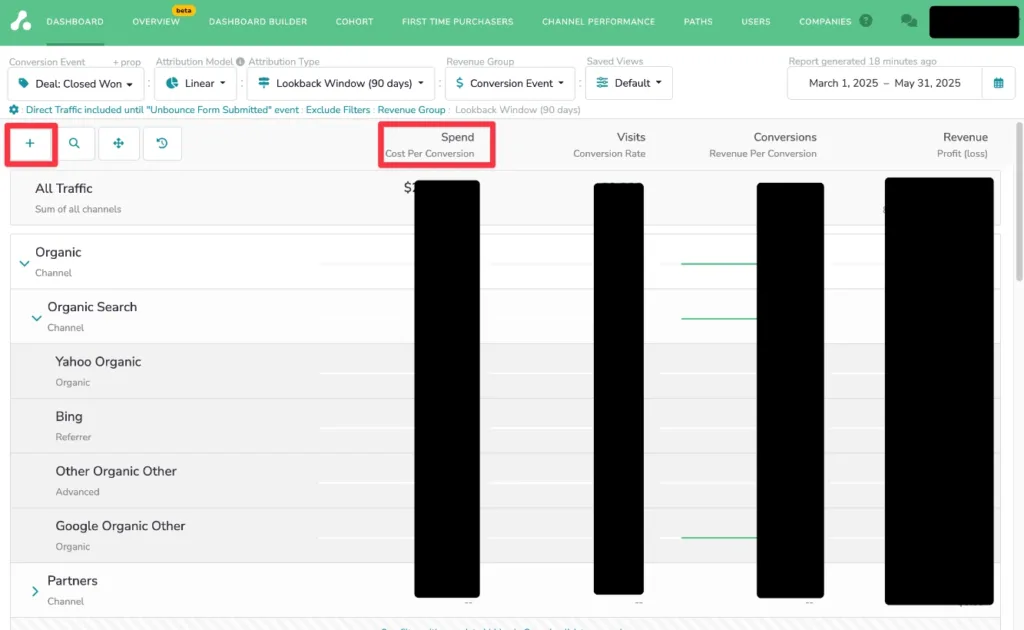
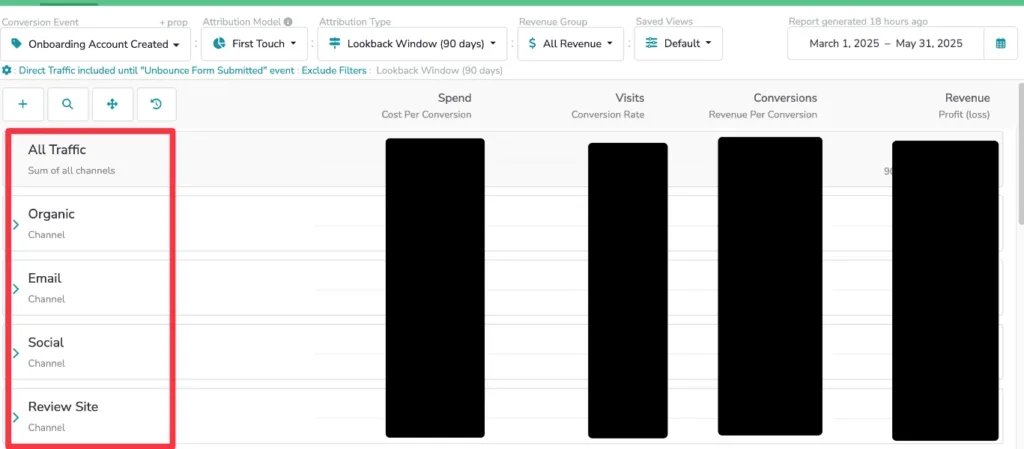
Step 5: Build Your Marketing Attribution Dashboard
A good attribution dashboard quickly shows important insights. Use The Attribution Platform’s “Dashboard Builder” to create custom views by team, channel, or funnel stage in real time.
Laying Out The Dashboard
Group key metrics:
- Use top panels for core KPIs (e.g., Spend, Conversion Rate, ROAS).
- Add charts like customer paths or cohort analyses for context (The Attribution does this automatically).
- Create sections for top channels, campaigns, and conversion events.
Use a clear visual hierarchy: place the most important information at the top and group related data to reduce cognitive load.
The Attribution Platform offers a drag-and-drop interface for easy organization.
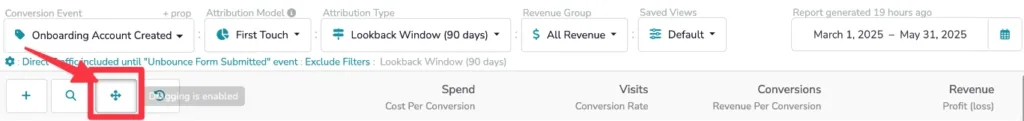
Filtering and Drill-Down
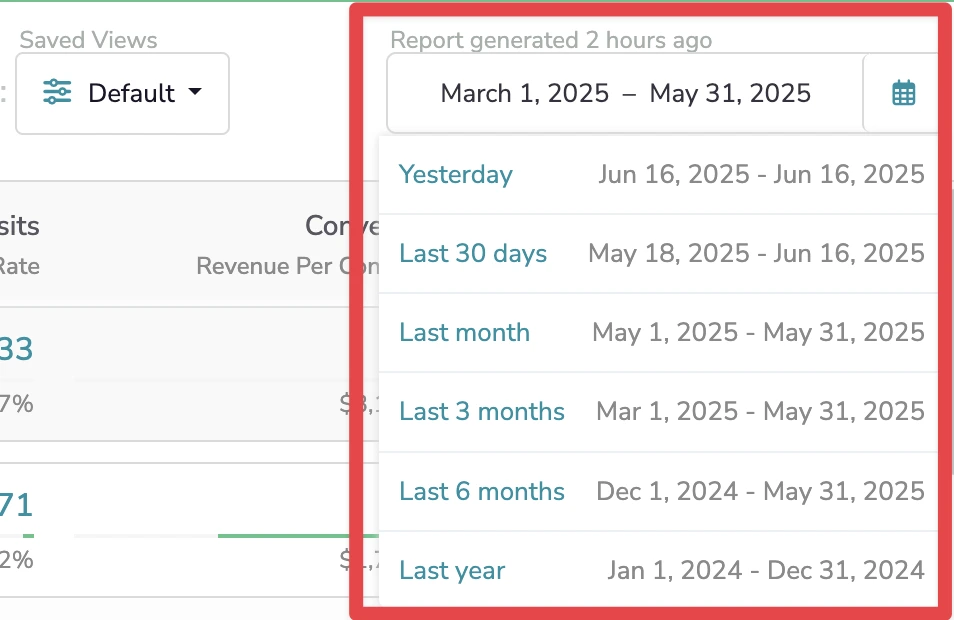
Add filters for date, channels, campaigns, or UTM parameters to focus on specific performance drivers. Use drill-downs to investigate anomalies like sudden ROAS drops or traffic spikes in the dashboard.
Drill-downs reveal root causes by breaking down metrics by touchpoint, region, or device. The Attribution Platform uses dynamic filters and responsive layouts, letting non-technical users explore data deeply without exporting to spreadsheets.
Creating Role-Specific Views
Create dashboards for each audience:
- Executives: high-level KPIs and trends.
- Channel managers: detailed performance by ad group or UTM.
- Growth teams: funnel drop-offs and conversion assists.
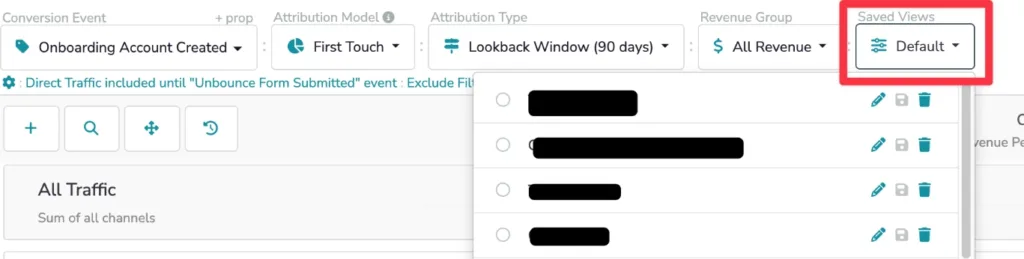
Use saved views to keep filters and layouts for recurring reports.
The Attribution Platform supports team accounts, allowing secure and clutter-free access with specific permissions.
Step 6: Advanced Use Cases For Deeper Insights
The Attribution Platform supports advanced use cases like post-purchase tracking, cohort analysis, and cross-device attribution. Flexible dashboards with these advanced features adapt as your strategy evolves, whether you’re in subscription-based, PLG, or E-Commerce business models.
Tracking Post-Conversion Events
Capture renewals, up-sells, and referrals to show full marketing impact, especially for SaaS or PLG models. Within The Attribution Platform, define custom events and link them to original touchpoints.
Use this approach to find channels that drive long-term revenue. Track users who sign up via organic search and later upgrade after a product milestone. The platform’s lifecycle tracking links these events, so you can optimize for customer quality, not just acquisition volume.
Cohort Analysis
Cohort tracking analyzes user behavior over time. Group users by sign-up date, campaign, or UTM tag on the dashboard to compare retention, revenue, or ROAS.
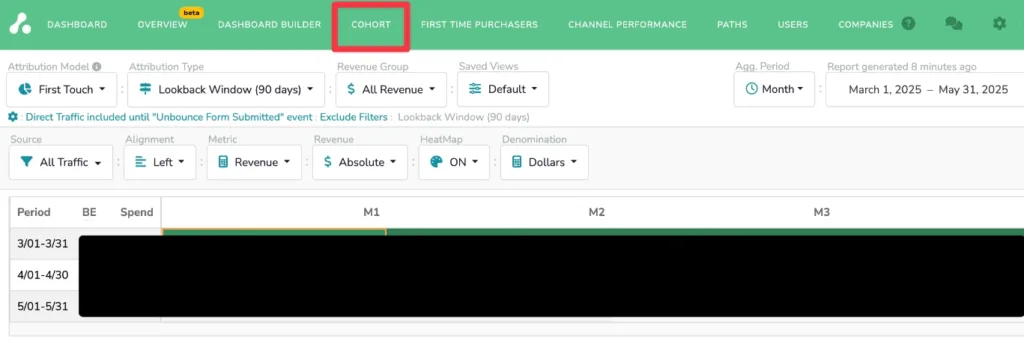
The analyses reveal if recent campaigns attract more valuable users than earlier ones and how seasonality affects performance. The Attribution Platform simplifies cohort creation for quick comparisons.
Cross-Device And Cross-Platform Journeys
The Attribution Platform connects touchpoints across devices and platforms, resolving fragmented sessions with deterministic attribution methods.
This approach shows a combined journey view, showing how someone engaging across devices converts. The platform’s cross-device tracking works automatically, so no manual data cleaning is needed.
Step 7: Maintain and Validate Your Attribution Dashboard
After setting up the dashboard, maintain accuracy with regular audits, benchmarking, and data validation to ensure reliable insights and trust in your marketing’s revenue contribution.
The Attribution Platform has built-in tools for a simple, consistent process.
Regular Data Auditing
Set a schedule (monthly or quarterly) to validate key metrics. Compare CRM conversions with attributed conversions to find gaps. Check for mismatched UTM tags, missing cost data, or unclassified source traffic.
Common issues include duplicate tracking, broken pixels, or untagged campaigns. Automated monitoring flags these inconsistencies, so you can fix them before they skew reporting.
Benchmark Performance
Use benchmarks to find anomalies and understand trends. Track historical performance by channel, funnel stage, or campaign type. Compare industry averages for conversion rates, CAC, or ROAS to assess competitiveness.
Benchmarks identify genuine performance shifts from seasonal or campaign noise. The platform provides reports for different periods.
Iterative Improvement
Your dashboard should evolve as your team grows and strategies shift. Collect user feedback on what’s missing or unclear. Regularly review dashboards to streamline views, update KPIs, or add new segments.
The Attribution Platform offers flexible layouts and saved views for easy updates. The customer success team helps optimize dashboards and provides strategic guidance.
Get Clarity With A Custom Attribution Dashboard
An attribution dashboard shows the impact of every channel, campaign, and touchpoint for better optimization.
The Attribution Platform lets you combine data, compare models, and get real-time insights for smarter decisions.
Creating a tailored dashboard helps you understand what’s driving results and where to invest next. Book a demo with our team to start building your custom attribution dashboard today.
Attribution Dashboard FAQs
Which attribution model is best for B2B businesses with long sales cycles?
Time-decay is ideal for B2B, but if your customer journey is unique, create a custom attribution model.
How does an attribution dashboard handle offline or event-driven data?
Integrate with your CRM to log offline or event-driven data, or use manual CSV uploads for non-digital data.
How can I demonstrate ROI to executives using my attribution dashboard?
Use your attribution dashboard to show how channels and campaigns drive revenue, reduce acquisition costs, and improve marketing efficiency.