Not all marketing is about using paid ads to acquire customers.
Inbound marketing is effective because it focuses on attracting customers who are actively looking for solutions rather than interrupting them with ads when they might not be interested.
But while the approach can be effective, one common challenge marketers face is accurate tracking and ROI measurement—and budget misallocation as a result. The best solution to this problem is using multi-channel attribution to build an accurate picture of inbound ROI performance.
For this guide, we’ll cover details about what inbound marketing ROI is, how to measure and optimize it, and how to translate your metrics into meaningful insights for your executive team.
Key takeaways:
- Use multi-touch attribution and cohort-based reporting to reveal the full impact of inbound across the customer journey.
- Align sales and marketing with shared dashboards and feedback loops to continuously refine targeting, lead quality, and conversion efficiency.
- Tie inbound metrics to financial outcomes by translating them into CAC, LTV, and revenue to earn executive buy-in.
What Is Inbound Marketing ROI?
Inbound marketing is the method of attracting loyal customers by building valuable content and experiences that align with your audience needs. Return On Investment (ROI) is a metric you use to calculate whether a marketing effort is producing positive results—the formula is:
ROI = ((Revenue – Cost) / Cost) x 100
By filling in the formula with your inbound marketing revenues and costs, you find your inbound marketing ROI.
For example:
ROI = (($20,000 – $5,000) / $5,000) x 100
ROI = 300%
Anything over 0 is a positive result, but the more the better.
Accurately calculating revenue attribution is different from using single-touch metrics because it gives you a more holistic insight into your total inbound efforts (rather than focusing on one type of interaction).
But to do so, you need to make sure every inbound asset—blogs, ebooks, webinars, etc.,—is measured for impact on revenue.
Why Companies Often Misallocate Budget
Companies often misallocate marketing budgets because they rely on flawed attribution models like first-touch or last-touch (last-click), which ignore the full customer journey. They might credit all success to one standout channel or metric, leading to over-investment there and neglect performance elsewhere.
Without holistic insights, businesses underfund high-performing but less obvious touchpoints and overspend on channels that don’t convert.
This tunnel vision distorts ROI tracking, resulting in inefficient spend. These missteps ultimately undermine inbound marketing performance and stunt company growth.
As a result, a data-informed, multi-touch approach is essential for aligning budget with actual impact across the full funnel.
How To Measure Inbound Marketing ROI
Tracking and measuring inbound marketing ROI involves five steps from establishing clear KPIs and tracking infrastructure to benchmarking for future comparisons.
But it’s also important to know that measuring ROI isn’t a one-time process. You need consistent data collection, cross-team alignment on KPIs, and ongoing optimization for growth.
Throughout the iterative process, accurate measurement requires both quantitative and qualitative insights. Let’s detail how to get them.
Step 1: Establish Clear KPIs And Tracking
To establish clear KPIs, first align metrics with each stage of your marketing funnel and overall business goals. Here are a few examples:
- Awareness stage (TOFU): Website traffic, page views, page rankings, social engagement.
- Engagement stage (MOFU): Leads and MQL’s.
- Conversion stage (BOFU): SQL’s or opportunities and pipeline value.
- Revenue and ROI: Customer Acquisition Cost (CAC), marketing-sourced revenue, inbound ROI.
But you need to choose KPIs based on your business’s sales cycle length and product complexity.
With KPIs in place, you can set up tracking.
Set up analytics tools like Google Analytics 4 and other marketing automation platforms (like HubSpot or Marketo) to track user behavior and lead lifecycle stages.
Use UTM parameters on all inbound links to attribute traffic correctly and tag consistently to avoid data gaps, for example:
utmsource=twitter&utmmedium=social&utm_campaign=webinar
For KPIs, track: blog content by page views and lead conversions; email campaigns by open rate, CTR, and MQLs; and social media by engagement, traffic, and assisted conversions.
Step 2: Calculate Costs Accurately
A massive component of measuring ROI accurately is getting the costs right. You need to track both direct costs like freelancer/agency fees, and indirect costs like staff time, software subscriptions, and web hosting.
For those indirect costs, estimate staff hours and software usage, and assign hourly rates and license percentages. Allocate shared sources like design or analytics based on usage.
If a marketer spends 10 hours on a campaign and their hourly rate is $30, that’s $300 in indirect cost. If your email platform costs $100/month and that campaign used about 25% of its features that month, allocate $25 of the license cost to the campaign.
Always use a standardized cost-tracking system like a spreadsheet or project management tool to log expenses under consistent categories. Then, tag entries by campaign or channel to analyze ROI accurately.
Step 3: Incorporate Multi-Touch Attribution
Every inbound channel and piece of content contributes to the overall buyer journey. A specific (paid) journey can be as simple as:
- Google Ad > Landing Page > Account Creation/Purchase
Or it can involve lots of inbound touchpoints, like so:
- Google Search > Blog Post > Free Account Sign Up/Demo > Welcome Email Sequence > Feature Walk-through Guide > Paid Account Sign Up
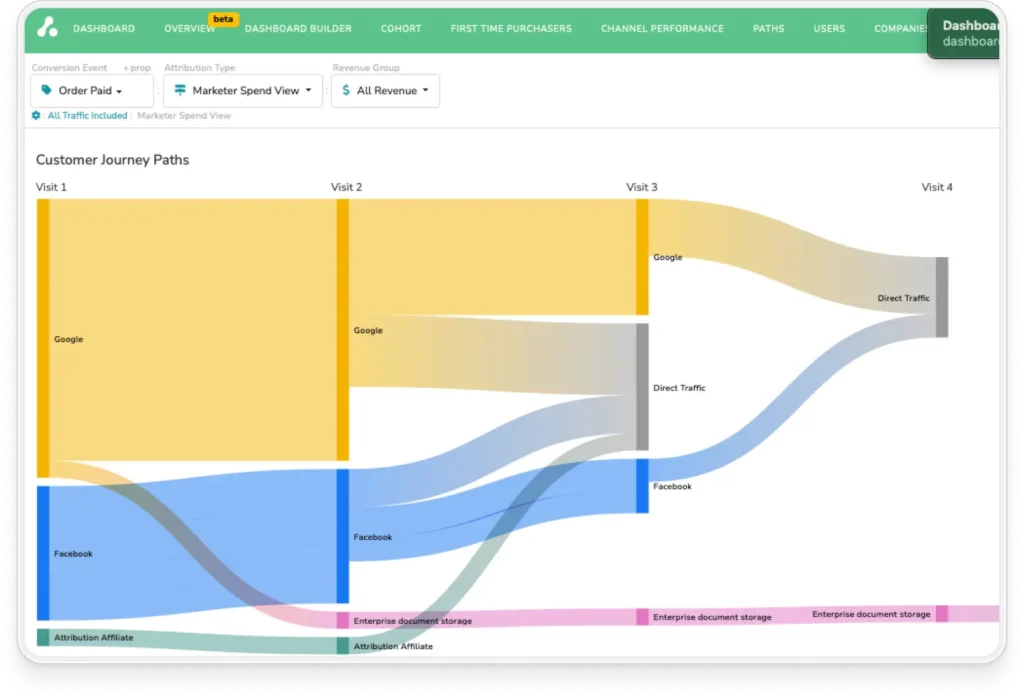
With multi-touch attribution modeling, you can assign revenue credit to each interaction leading up to the final conversion. There are a few multi-touch models to choose from, including:
- Linear attribution: best for when you want to give each interaction equal credit.
- Time-decay attribution: best for conversions influenced more by recent touchpoints or for prioritizing BOFU activities.
- Position-based attribution: best for when you want to credit both lead and conversion touchpoints.
- Custom attribution models: best for when you have a more complex customer journey and you have good historical data showing you touchpoint influence.
The Attribution Platform can automate this whole process for you, and give you the option to toggle between different attribution models for comparison.
Book a Demo
Understand the precise impact of each marketing touchpoint and track “true” CAC, ROAS, and ROI on marketing spend with The Attribution Platform.
Step 4: Perform Cohort Analysis
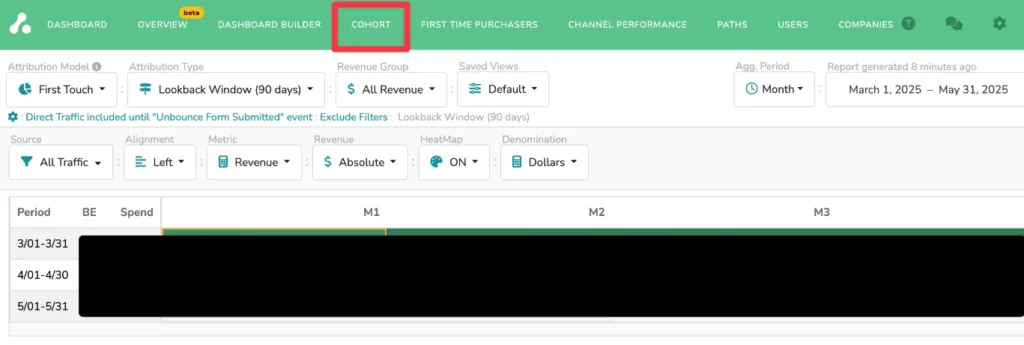
One of the benefits of inbound marketing is long-term, sustained value. Tracking inbound leads over time shows long-term revenue impact and proves its value beyond immediate conversions.
Instead of focusing on quick wins, you can follow leads by cohort—grouped by acquisition month or campaign—to measure how they convert and generate revenue over time.
You can set this up in your CRM or analytics platform by tagging leads with source and date, then monitoring their progression through the funnel.
The Attribution Platform offers automated tools for cohort-based modeling, which offers clear visibility into which inbound efforts deliver lasting ROI, not just short-term spikes.
Step 5: Use Benchmarks And Industry Reports
After setting up traffic and gathering data for a specified period (e.g., 30 days, quarter, annual, etc.), you’ll have what you need to create internal benchmarks to compare the performance of future campaigns.
If you don’t have that data yet (and even if you do) it’s a good idea to reference credible external benchmark reports to compare your KPIs against industry norms. This contextual data will help inform realistic revenue goals and budget decisions.
Some examples of typical conversion rates and ROI figures across different industries, according to Unbounce, include:
- Landing pages (median average conversion):
- SaaS: 3.8%
- E-Commerce: 4.2%
- Commercial/Professional services: 6.1%
- Financial services: 8.3%
- Email: 19.3% average conversions
While FirstPage Sage suggests the following ROI benchmarks for SEO efforts:
- B2B SaaS: 702% (7 months break-even)
- Biotech: 788% (8 months break-even)
- E-Commerce: 317% (16 months break-even)
- Financial services: 1,031% (9 months break-even)
- Manufacturing: 813% (9 months break-even)
With these tracking and measuring steps in place, you’ll be in the best position to start optimizing your inbound marketing ROI.
How To Optimize Inbound Marketing ROI
Optimizing your inbound marketing ROI is about running cycles of continuous improvements: measure, analyze, adjust, repeat.
Your attribution data should help guide ongoing changes to your content, campaigns, and channel mix. Let’s take a look at a few strategies you can use to make those changes that boost inbound ROI.
Strategy 1: Refine Content And Channel Mix
Your attribution data will tell you which content formats (e.g., blog posts, webinars, emails, etc.) are generating revenue.
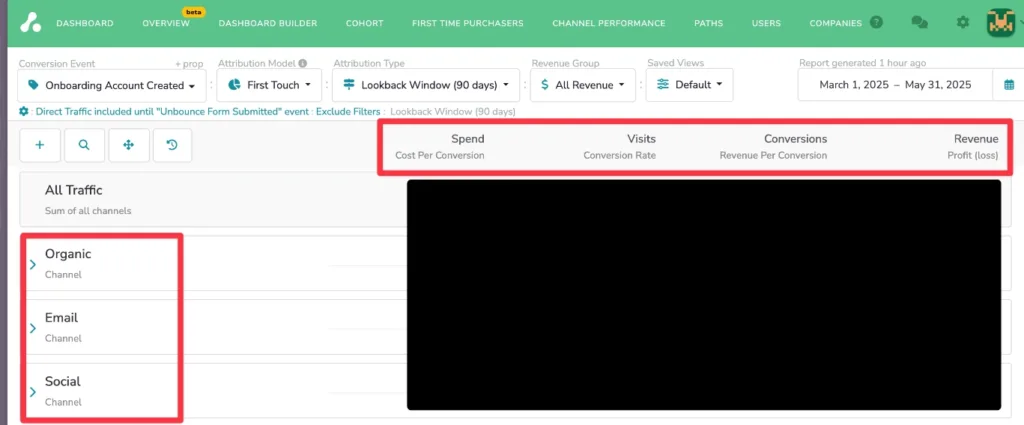
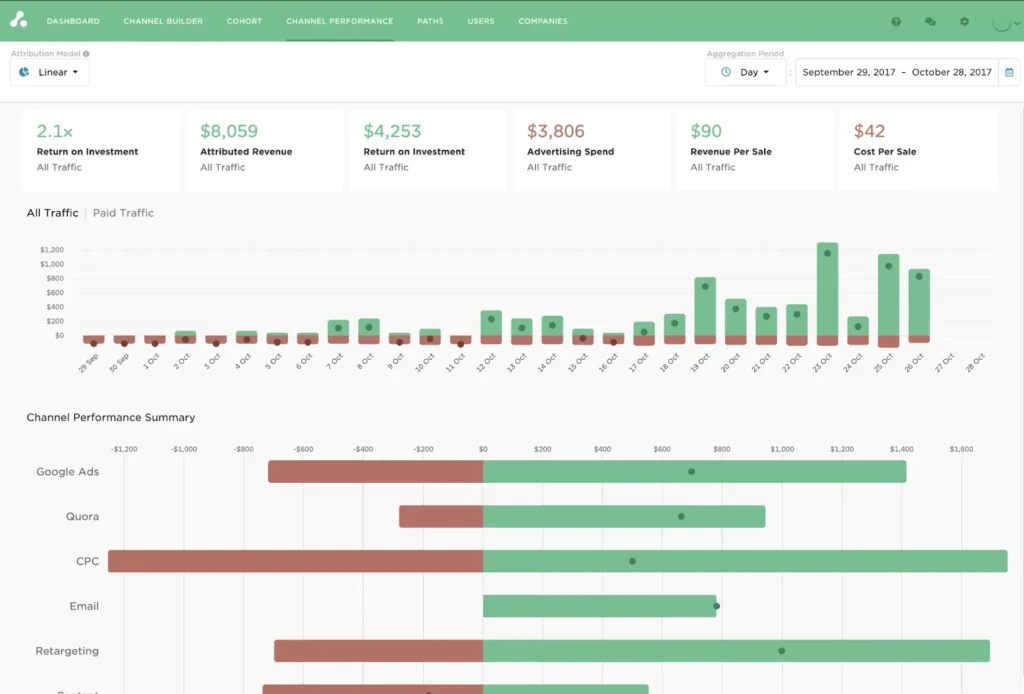
As you can see in the image above, The Attribution Platform offers a dashboard that combines all of your inbound marketing data. You’ll be able to see performance at the channel level or drill down to specific campaign efforts (in real time).
With these insights, you can prune under-performing inbound efforts and invest more into high-performing efforts.
Conduct content audits on a quarterly basis to find those optimization opportunities.
Strategy 2: Align Sales And Marketing Efforts
Create consistent feedback loops between sales and marketing to flag gaps in lead quality or nurture workflows early.
When CRM and marketing automation data are integrated with your attribution dashboard, your teams can refine targeting, tailor follow-ups, and improve conversion rates. You’ll also find teams are better able to stay aligned on MQL-to-SQL rates and revenue attribution.
Tools like The Attribution Platform link marketing activities directly to closed deals, helping both teams see what drives outcomes, not just clicks or form fills. See, for example, the dashboard with a Closed Deal conversion event filter:

Strategy 3: Optimize Conversion Paths
Conversion paths can sometimes produce bottlenecks—you can identify them by analyzing drop-off points, like high traffic but low lead capture on landing pages.
You can then use conversion rate optimization (CRO) practices like A/B testing to refine CTA’s, form lengths, and page layout. Even a small uplift, like improving a 2% conversion rate to 3%, can significantly boost overall ROI.
Other tactics like adding social proof, reducing form fields, improving page speed, or clarifying value proposition messaging tend to give quick CRO wins.
The idea is to continuously test and iterate based on your data. Optimizing conversion points turns more of your existing traffic into leads and revenue, making your inbound spend more efficient.
Strategy 4: Automate Reporting And Dashboards
When you’re running several inbound marketing campaigns, building performance reports can take a significant portion of your time. Real-time reporting tools (like The Attribution Platform) save time for you and your team by reducing manual spreadsheet work.
After building their real-time attribution dashboard, Vendr saved 2–3 days per month in manual analysis (and saw an 8.6x increase in ROAS).
Create a standardized dashboard to share with stakeholders for transparency and accountability, and create specific saved views for executive, tactical, and operational dashboards. For each, include:
- Executive:
- Marketing-sourced revenue
- Cost per Acquisition or Customer Acquisition Cost (CPA or CAC)
- ROI by channel/campaign
- Customer Lifetime Value (LTV)
- Pipeline influenced by inbound
- Top-performing channels (revenue-driven)
- Lead-to-customer conversion rate
- Tactical:
- MQLs and SQLs by source
- Conversion rates by funnel stage
- Revenue per campaign
- Attribution model comparisons
- Touchpoint performance
- Time-to-convert by channel
- Operational:
- Landing page conversion rates
- Form submission rates
- UTM campaign performance
- A/B test results
- Funnel drop-off rates
Ideally, each dashboard should roll up into the next, or be easily accessible as Saved Views to support tailored decision-making.
Connect Inbound Metrics To Financial Outcomes
With those above dashboards set up, you’ll be in a position to translate inbound performance into financial outcomes that resonate with leadership.
Some metrics we mentioned, including CAC, LTV, and net revenue impact, are metrics CFOs will be familiar with. Use them to demonstrate how inbound efforts contribute not just to the pipeline, but to actual profit.
Use can also use advanced multi-touch attribution and cohort-based reporting to map the full customer journey from first touch to closed deal. These analyses show how each channel or campaign influences revenue over time.
Visual frameworks, such as funnel overlays or path diagrams help clearly link marketing actions to business results.
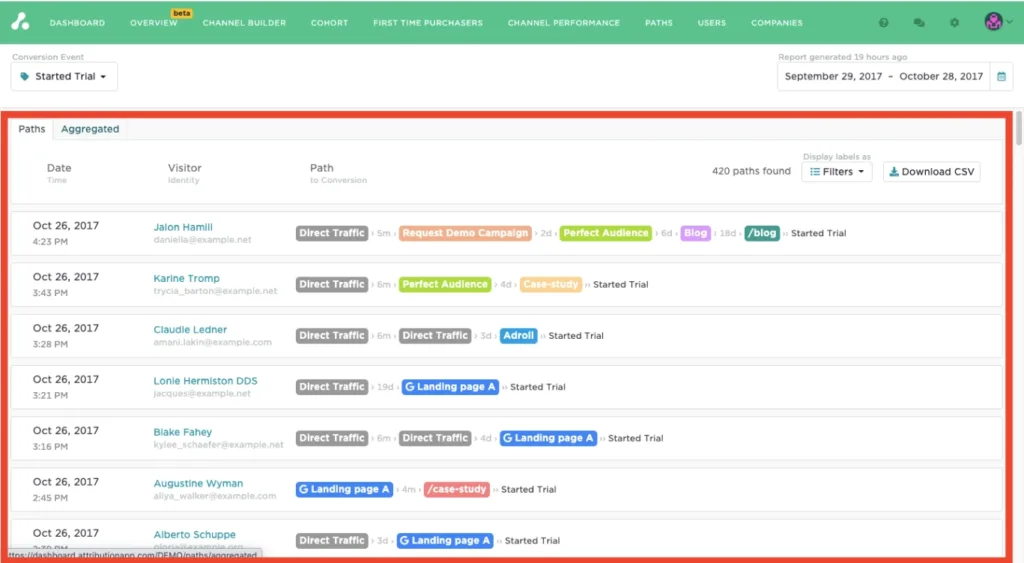
The Attribution Platform automates this reporting process by integrating your sales and marketing data into a dashboard that highlights ROI at every touchpoint. These reports help you justify budget, guide strategy, and speak the financial language the C-Suite expects.
Measure And Optimize Your Inbound Marketing Performance With The Attribution Platform
Inbound marketing ROI has traditionally been difficult to attribute due to data gaps and silos, and not being able to tie efforts to revenue. This scenario creates guesswork and ultimately creates budget uncertainty and misallocation.
With a holistic, multi-touch attribution approach, you can get accurate measurements of cost and revenue data to find which efforts produce the most ROI. These insights lead to clearer optimization opportunities and higher returns.
The Attribution Platform offers your team a single source of truth—a dashboard that combines all of your inbound (and paid) marketing channels and campaigns alongside the cost data critical for assessing ROI.
Sign up and try Attribution today — pinpoint CAC by channel, audit funnels and conversion rates, scale revenue-driven content marketing, measure affiliate LTV and CAC (and more).
Inbound marketing ROI FAQs
How long does it typically take to see positive ROI from inbound marketing?
Based on available data, the average break-even time for organic SEO is 9.6 months. Other inbound efforts like social media and email depend on your business and industry.
How can I start using multi-touch attribution for inbound?
The best way to start multi-touch attribution is using UTM parameters across your inbound marketing campaigns. Make sure you standardize naming conventions to keep stakeholders aligned.
What are the most common mistakes when measuring inbound marketing ROI?
The most common mistakes are using single-touch attribution models that ignore the full customer journey, and tracking misconfiguration.
How can I prove inbound marketing ROI to executives?
Use a tailored dashboard report that illustrates metrics they’re familiar with, including CAC, ROI by channel, LTV, and top-performing channels by revenue.
